Shoplifting Trends in Time and Space
A Study of Two Major American Cities
November 2024
By Bobby Boxerman, M.A., University of Missouri—St. Louis, and
Kelsey Cundiff, Ph.D., University of Missouri—St. Louis
This report focuses on reported shoplifting in Chicago, IL, and Los Angeles, CA, from 2018 through 2023. It uses incident location data to examine reported shoplifting prevalence and concentration in both cities and how these have been affected by the COVID-19 pandemic. It also examines how patterns in reported shoplifting may be related to the concentration of retail establishments. The pandemic is central to this analysis because property crime patterns, especially for larceny and shoplifting, are sensitive to changes in patterns of activity, such as the major shifts in public life that occurred under stay-at-home orders in response to the emergence of the COVID-19 pandemic. This report is focused on the periods directly before, during, and after the pandemic to lend context to the increased interest and attention related to shoplifting at the national level.
Key Takeaways
- In Chicago, the year-end rate of reported shoplifting was 11.6% lower for 2023 than it was for 2018. In Los Angeles, the rate for 2023 was 77% higher than it was for 2018.
- Prior to the pandemic, the shoplifting rate in Los Angeles was less than half that of Chicago. By the end of 2023, the difference between the two cities had narrowed and the Los Angeles rate was 17.7% lower than that of Chicago.
- In Chicago, the top 5% of all reported shoplifting locations by address had 68.5% of all reported shoplifting from 2018 to 2023. In Los Angeles, the top 5% of addresses had 62.8% of all reported shoplifting during this period.
- Shoplifting patterns between the cities differed greatly. Chicago shoplifting clustered in two geographically close areas, while shoplifting in Los Angeles was distributed across multiple smaller areas that were less concentrated than in Chicago.
- In Chicago, areas with substantial concentrations of retail outlets did not consistently experience concentrated amounts of shoplifting. In Los Angeles, however, there was considerable overlap between retail and shoplifting clusters.
- Both cities saw large drops in reported shoplifting in 2020, likely due to store closures at the start of the COVID-19 pandemic. For both cities, in 2020 and 2021, shoplifting was less prevalent and concentrated in fewer areas.
- Portions of both cities that were not high-shoplifting areas before and during the pandemic began to experience increases in shoplifting after the pandemic (2022 and 2023).
- Shoplifting in both cities was often highly concentrated in places with high concentrations of other crimes, such as other types of theft and violent offenses.
Glossary
- Pre-Pandemic Period: Identified as the years 2018 and 2019
- Pandemic Period: Identified as the years 2020 and 2021
- Post-Pandemic Period: Identified as the years 2022 and 2023
- Retail Cluster: Area with at least twice the citywide average concentration of retail outlets
- Retail Outlet: Any business that sells goods, including those whose primary business is service (e.g., a barbershop that sells hair products), identified by business license information available on the cities’ websites
- Shoplifting Cluster: Area with at least twice the citywide average level of reported shoplifting incidents
Introduction
This report examines place-specific reported shoplifting trends in two major American cities, Chicago and Los Angeles. The data used for the analysis were drawn from the cities’ open data portals. These two cities were selected because they consistently reported shoplifting-specific data with location information in the past five years and had geographic data available for city business licenses.
To identify specific areas in each city with high reported shoplifting concentrations, clusters were created. These clusters were areas with at least twice the citywide average of shoplifting incidents. They were identified for each year and for each city using kernel density estimation (see supplemental methodology for more detail). Clusters of retail outlets were also identified, using a similar process.
The data in this report reflect shoplifting incidents that were reported to law enforcement authorities and almost certainly undercount total shoplifting incidents. Potential factors that may affect reporting include retailers’ anti-theft measures and changes in how retailers report shoplifting to law enforcement. Reporting to authorities could be influenced by retailers’ perceptions of the extent to which local police or prosecutors will apprehend suspects and pursue criminal charges. The findings presented here should be viewed with these considerations in mind.
Reported Shoplifting Trends in Chicago and Los Angeles, 2018 to 2023
In Chicago, the year-end rate of reported shoplifting for 2023 was 11.6% lower than it was for 2018. In Los Angeles, the full-year rate for 2023 was 77% higher than it was for 2018. Examining monthly trends creates a more complete picture of patterns in both cities before, during, and after the pandemic. Figure 1 displays monthly reported shoplifting incidents and rates per 100,000 population. Reported shoplifting rates stayed relatively constant through 2019, then decreased in the early months of 2020 before rising steadily from June 2020 through the end of 2023. In January 2018, the shoplifting rate in Los Angeles (15.5) was 52.7% less than in Chicago (32.8). By the end of December 2023, the gap between the two cities had narrowed and the Los Angeles shoplifting rate (24.3) was 17.7% lower than Chicago’s (29.5).
The crime incident data for this report were obtained within days of the end of the study period. As a result, these figures may-and often do-differ from data subsequently published by individual police departments. The findings also may differ from other counts released later by the FBI as part of its national crime reporting program. In addition, the figures may differ from those in other CCJ reports because the data may have been collected on different dates.
Figure 1. Monthly Reported Shoplifting Incidents and Rates in Chicago and Los Angeles, 2018 to 2023
The rest of this report break downs shoplifting trends by city, first in Chicago and then in Los Angeles, in the three time periods before, during, and after the COVID-19 pandemic. For both cities, the COVID-19 pandemic initially reduced the amount of reported shoplifting as well as the number of places where reported shoplifting was intensely concentrated. During the pandemic, areas that had previously experienced concentrated amounts of reported shoplifting still did so, but to a lesser degree. Additionally, some other areas with above-average levels of reported shoplifting before the pandemic saw significantly fewer incidents in the pandemic years and did not meet the criteria to be considered a cluster of reported shoplifting. By 2023, however, incidents of reported shoplifting increased and new pockets of intensely concentrated reported shoplifting formed in both cities.
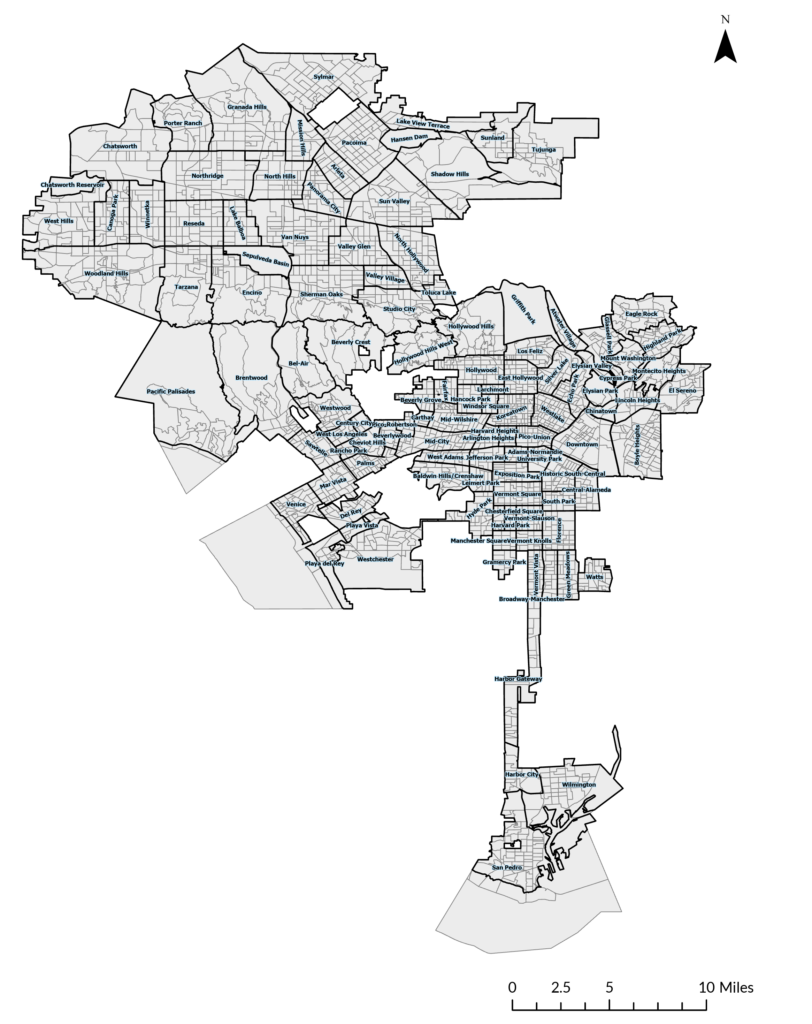
Note on reading maps: Maps show Chicago and Los Angeles census block groups and neighborhood designations. For maps depicting reported shoplifting, darker red colors denote greater concentrations of reported shoplifting at a given location, where the level of reported shoplifting is shown in intervals of the average level of reported shoplifting across the entire city. Maps depicting retail outlets show the concentration of outlets measured in intervals of the average concentration of retail outlets across the entire city (see the supplemental methodology report for more information). Darker red colors depict more retail outlets at a given place.
Chicago Shoplifting Trends
Key Takeaways
- In Chicago, the year-end rate of reported shoplifting was lower (-11.6%) for 2023 compared to 2018.
- Most shoplifting in Chicago took place in a large cluster in the downtown area and a smaller cluster in the Old Town/River North/Lincoln Park neighborhoods.
- Many areas in Chicago that had a high concentration of retail outlets did not have a high concentration of reported shoplifting.
- Reported shoplifting incidents decreased greatly during the pandemic, dropping from an average rate (per 100,000) of 33.3 in 2019 to 19.1 in 2020. The concentration of shoplifting incidents also decreased during the pandemic. After the pandemic, however, shoplifting rebounded almost to pre-pandemic levels.
- After the pandemic, several new shoplifting clusters emerged. Some areas that had low levels of reported shoplifting prior to the pandemic had high levels after the pandemic.
Shoplifting Patterns Before the COVID-19 Pandemic
In pre-pandemic Chicago, reported shoplifting was highly concentrated. Figure 2 shows the reported shoplifting concentration for Chicago in 2018. Locations with a high concentration of reported shoplifting were not widespread but clustered in a handful of areas. Reported shoplifting was extremely concentrated in one particular area, labeled cluster A on the map, which spanned multiple neighborhoods centered on the Loop (see Appendix Figure A1 for neighborhood names). In 2018, this shoplifting cluster occupied 2.2 square miles, or just under 1% of Chicago’s land area. Despite its relatively small size, this area contained 11.8% of the city’s retail outlets (see Table 1) and almost a quarter (24.7%) of all reported shoplifting incidents, which were highly concentrated at 1,202 incidents per square mile. A smaller shoplifting cluster (B) spanning the Old Town/River North/Lincoln Park neighborhoods occupied 0.23 square miles (0.1% of city land area) and contained 2.9% of all reported shoplifting in Chicago. Reported shoplifting in area B was also extremely dense—1,357 incidents per square mile.
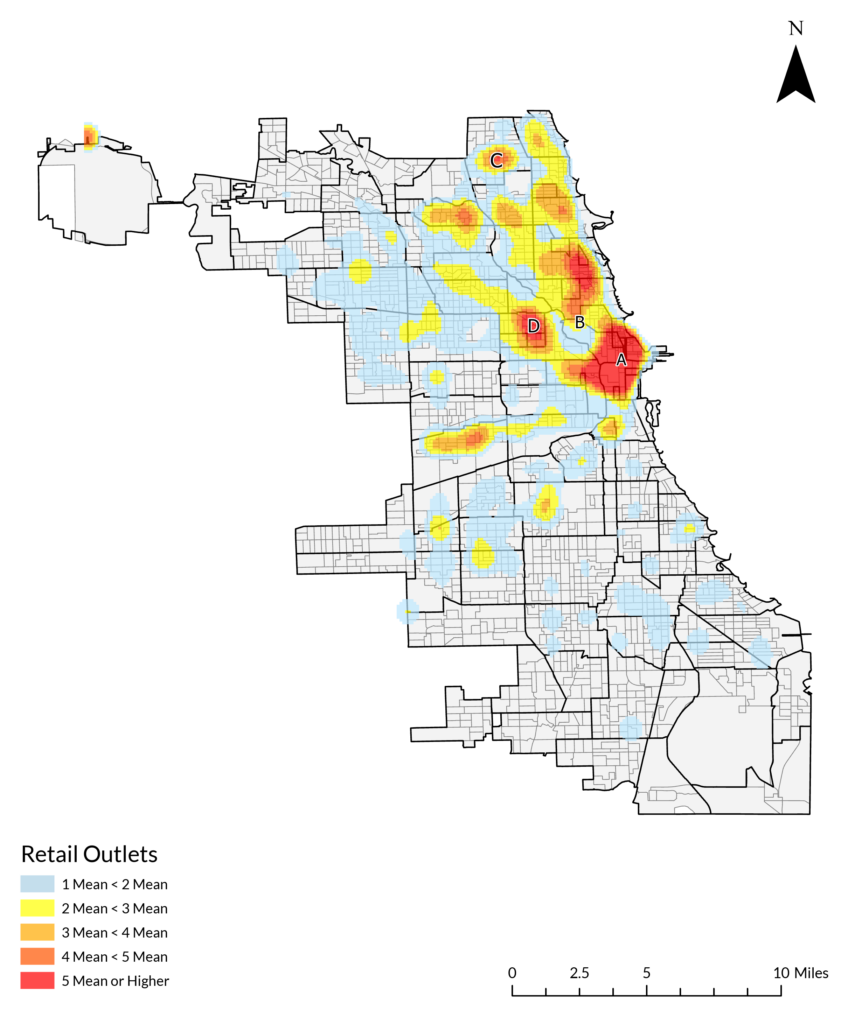
Most reported shoplifting took place in areas dense with retail outlets. But many of Chicago’s retail clusters had levels of reported shoplifting much closer to the citywide average (47 incidents per square mile) than to the high levels seen in the concentrated shoplifting clusters (more than 1,200 incidents per square mile). For example, a one-square-mile area (C) in West Ridge contained 1.6% of all retail outlets in the city but accounted for just over 0.1% of reported shoplifting incidents (or 11.8 incidents per square mile). Similarly, 3.2 square miles (D) in the Wicker Park/East Village neighborhoods contained 4.4% of all Chicago retail outlets, but relative to its size (1.4% of Chicago’s land area) and number of retail outlets, the area had a low concentration of reported shoplifting: 2.9% of all incidents, or less than 100 incidents per square mile. Table 1 below summarizes the four pre-pandemic shoplifting and retail clusters. These patterns were relatively unchanged for Chicago from 2018 to 2019. Figure 3 displays retail outlet concentration in Chicago in 2018.
Figure 2. Concentration of Reported Shoplifting in Chicago, 2018
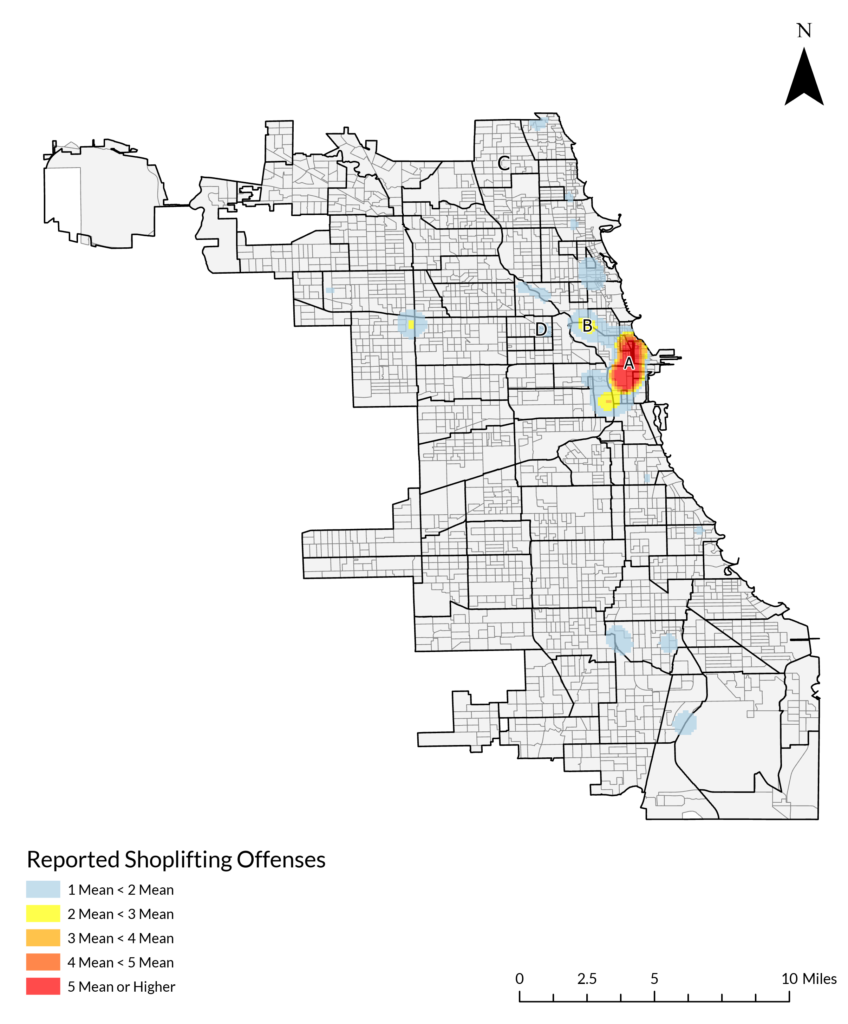
Table 1. Reported Shoplifting and Retail Outlets in Chicago, 2018
Figure 3. Concentration of Retail Outlets in Chicago, 2018
Reported Shoplifting During the COVID-19 Pandemic
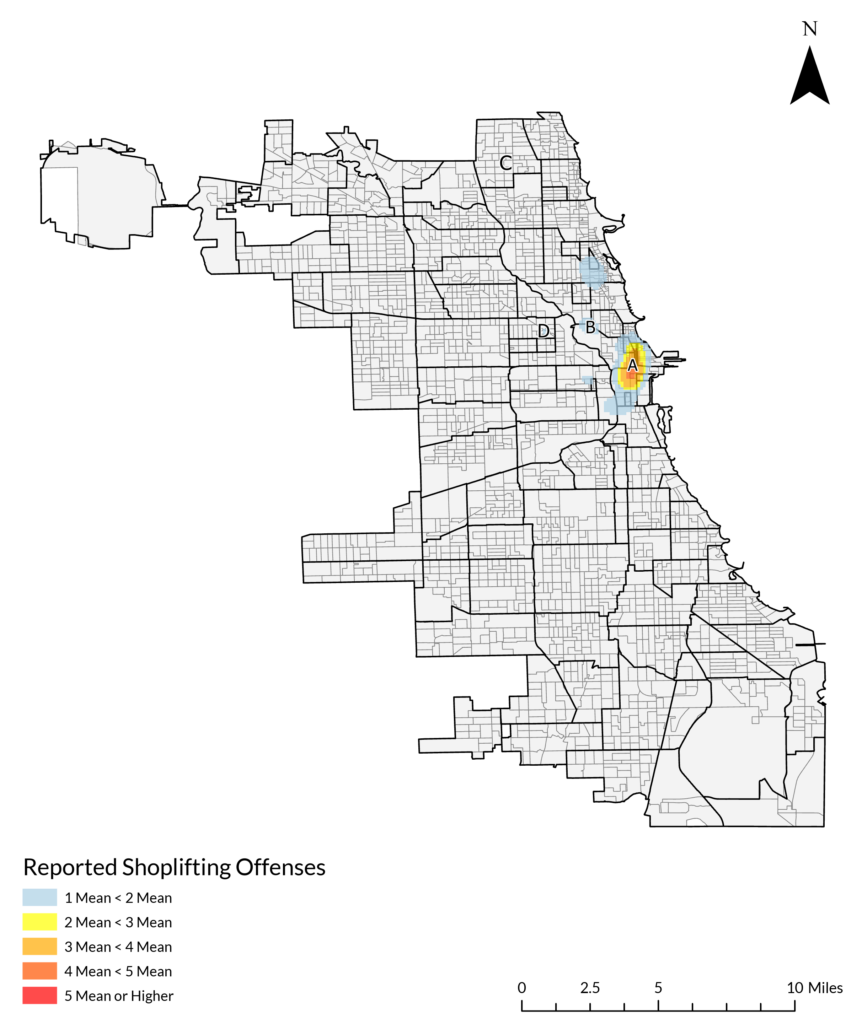
The average yearly reported shoplifting rate for pre-pandemic Chicago fell 71.7% by the end of 2021. From 2018 to 2020, shoplifting decreased significantly across the city, and high-concentration areas of reported shoplifting greatly diminished. The extent of area A’s shoplifting cluster (with at least twice the city average for incidents per square mile) decreased from over two square miles to just over one square mile. Area A had a 64.4% decrease in reported shoplifting incidents, and the number of incidents per square mile decreased from 1,202 in 2018 to 941 in 2020 (see Table 2). Reported shoplifting incidents in area A also concentrated further around retail outlets. In other words, as shoplifting decreased in the area, it became more closely associated with the highest-density retail locations.
In area B, Chicago’s smaller shoplifting cluster, the number of reported shoplifting incidents decreased by 55.4%. As a result, this area had just above average levels of reported shoplifting (Figure 4) and no longer fit our definition of a cluster. Other small areas of above-average reported shoplifting in 2018 dropped to average or below-average levels in 2020 and 2021. Many areas with a relatively large concentration of retail outlets, such as areas C and D, continued to experience low levels of shoplifting during this time.
Table 2. Reported Shoplifting and Retail Outlets in Chicago, 2020
Figure 4. Concentration of Reported Shoplifting in Chicago, 2020
Changes in Reported Shoplifting Post-COVID
In 2022 and 2023, after the height of the pandemic had passed, reported shoplifting in Chicago increased substantially, though the 2023 level remained 11.6% below what it was in 2018. Some areas that did not classify as concentrated reported shoplifting hotspots before the pandemic became reported shoplifting hotspots afterward. Area A remained a hotspot (Figure 5), although with 13.1% fewer reported shoplifting incidents in 2023 than in 2018. The amount of reported shoplifting in area B increased significantly after the pandemic, rising by 57.9% from 2020 to 2023 and reaching a level 5.5% higher than in 2018. Areas C and D, two places with a large concentration of retail outlets, remained consistent in their level of reported shoplifting from 2018 to 2023. Area C had four more incidents and Area D had seven more incidents per square mile in 2023 than in 2020 (see Table 3).
Several other concentrated shoplifting areas emerged by 2023. A small (0.4 square mile) area in the Boystown, Lakeview, and Lincoln Park neighborhoods increased notably in reported shoplifting in the post-pandemic period. This area was dense in retail outlets in 2018 (1.3% of all city outlets and 503 outlets per square mile) but had about average levels of reported shoplifting and was not a concentrated shoplifting area before the pandemic. In 2023, however, this area was responsible for 4.4% of all reported shoplifting in Chicago and was an extremely dense pocket of reported shoplifting, with over 1,000 incidents per square mile. Other, less extreme examples of this shift include areas in Uptown, Rogers Park, and Bucktown; they experienced average to just above average amounts of reported shoplifting in 2018 and 2019, but in 2023 had levels of at least twice the citywide average. Figure 5 shows these emergent post-pandemic shoplifting clusters circled in blue.
Figure 5. Concentration of Reported Shoplifting in Chicago, 2023
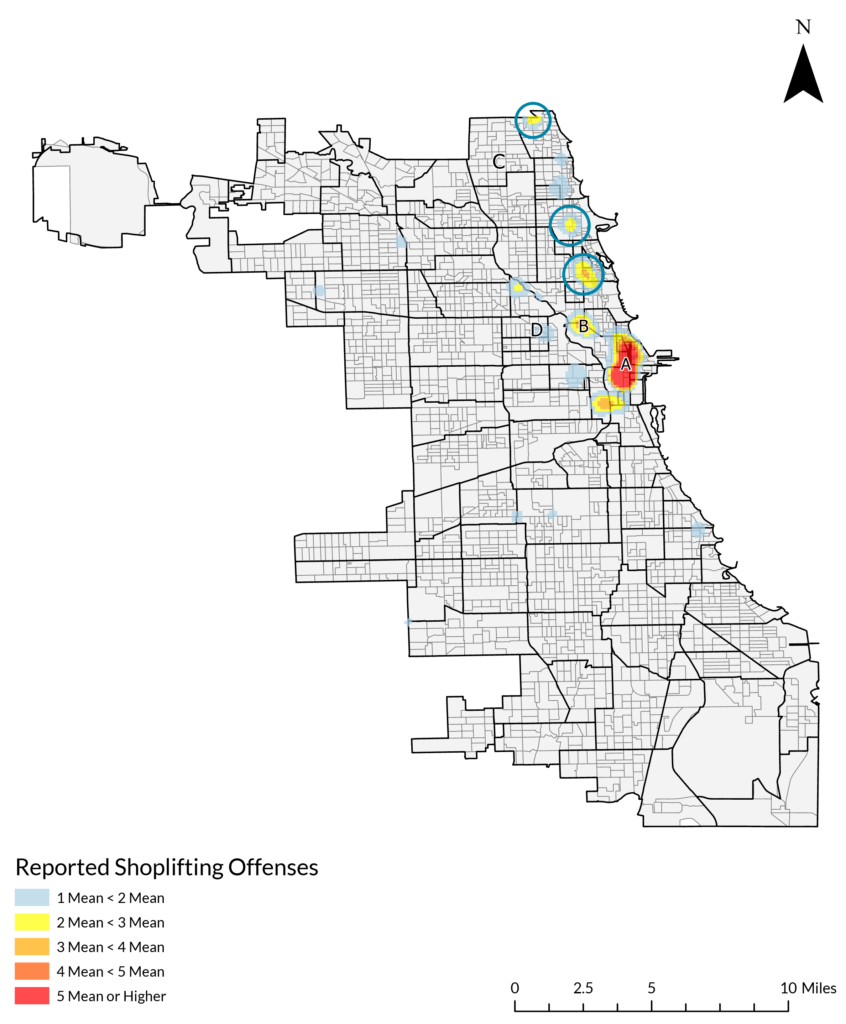
Table 3. Reported Shoplifting and Retail Outlets in Chicago, 2023
Los Angeles Shoplifting Trends
Key Takeaways
- In Los Angeles, reported shoplifting decreased significantly during the pandemic in both the number and concentration of incidents. The city’s year-end rate of reported shoplifting was 77% higher for 2023 compared to 2018. In mid-2021, reported shoplifting rates began a steady rise that extended well into 2023.
- For 2023, the city’s year-end rate of reported shoplifting was 77% higher than the year-end rate for 2018.
- Retail locations in Los Angeles were intensely concentrated in one large cluster in the downtown area. This area consistently experienced high levels of reported shoplifting from 2018 to 2023.
- After the pandemic, several new shoplifting clusters emerged. As in Chicago, some areas that had low levels of reported shoplifting prior to the pandemic experienced high levels after the pandemic.
Shoplifting Patterns Before the COVID-19 Pandemic
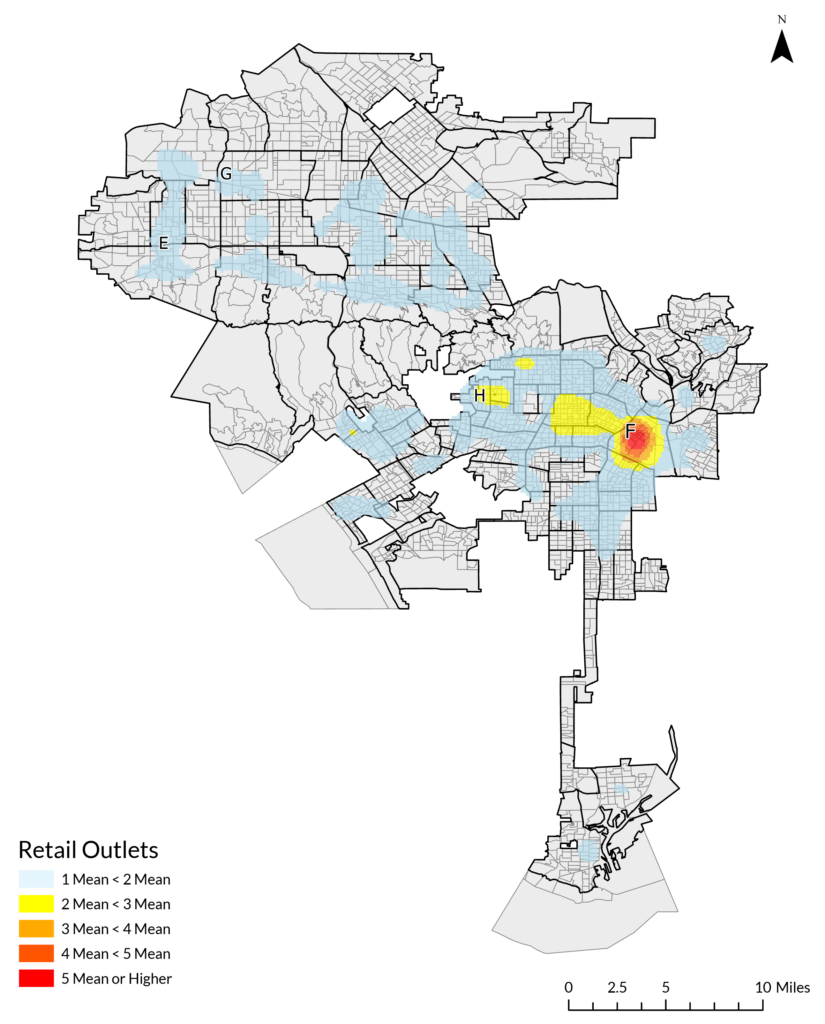
While Chicago had two geographically proximate and very concentrated areas of reported shoplifting in 2018 and 2019, Los Angeles had four geographically dispersed areas with large concentrations of reported shoplifting in those years. Figure 6 shows the first (E), which spans the Canoga Park, Winnetka, Woodland Hills, and West Hills neighborhoods (see Appendix Figure A2 for neighborhood locations) and the second (F), which spans the downtown, Westlake, Echo Park, and Pico-Union neighborhoods. Both areas were just over four square miles in size (0.9% of the city’s area), and both had roughly the same concentration of reported shoplifting. Area E had 7.6% of all reported shoplifting in Los Angeles in 2018, and area F had 7.9%. However, area E had a relatively low concentration of retail outlets (221 per square mile), while area F overlapped with the most concentrated retail area in Los Angeles, with 10.2% of the city’s retail outlets in 2018, nearly 1,400 per square mile (see Figure 7).
Table 4 summarizes these and two smaller reported shoplifting areas: one area (G) in the Northridge, Winnetka, and Chatsworth neighborhoods, and another (H) in the Beverly Grove, Fairfax, Carthay, and Mid-Wilshire neighborhoods. Reported shoplifting clusters in Los Angeles were considerably less dense than in Chicago. For example, area E qualified as a concentrated area for reported shoplifting in Los Angeles with 131.7 reported shoplifting incidents per square mile, compared to over 1,200 incidents per square mile in both of Chicago’s shoplifting clusters. Reported shoplifting in Los Angeles in 2018 and 2019 was not only lower in prevalence than in Chicago, but also much less concentrated. The 2018 citywide average for reported shoplifting incidents per square was more than three times higher in Chicago (47) than in Los Angeles (14).
Figure 6. Concentration of Reported Shoplifting in Los Angeles, 2018
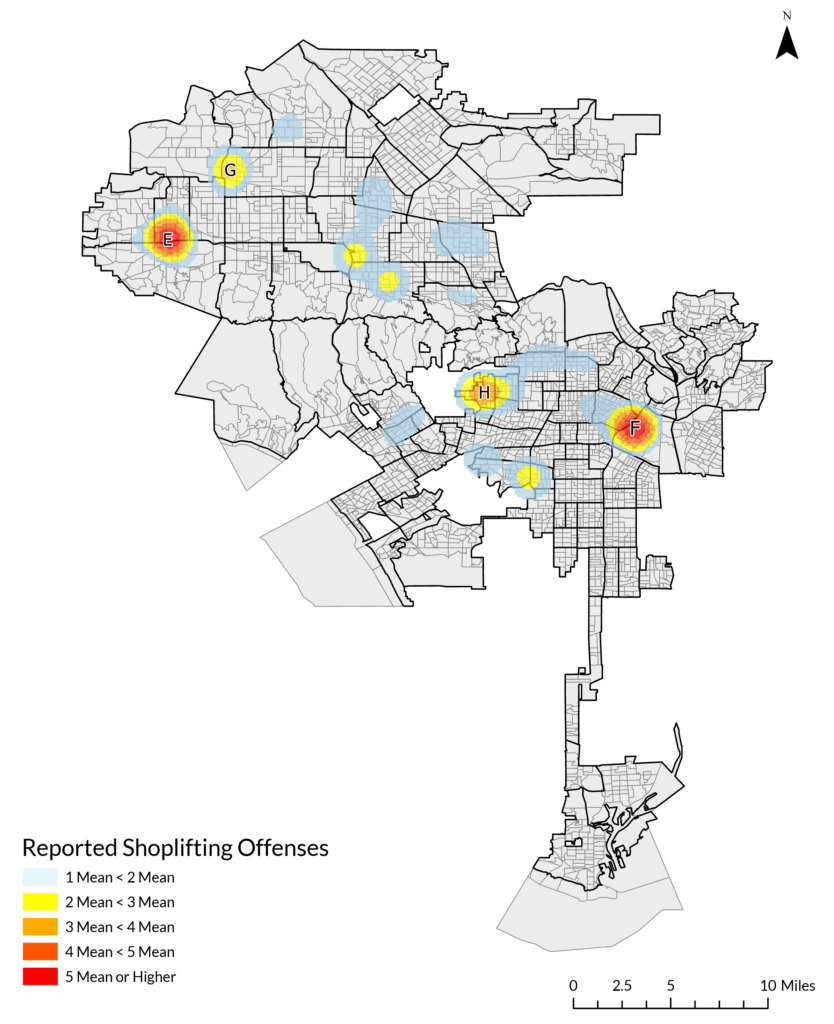
Table 4. Reported Shoplifting and Retail Outlets in Los Angeles, 2018
Figure 7. Concentration of Retail Outlets in Los Angeles, 2018
Reported Shoplifting During the COVID-19 Pandemic
Los Angeles experienced patterns similar to Chicago’s in 2020. High-shoplifting areas consolidated, the level of reported shoplifting in those areas decreased, and several places in both cities that had above-average levels of reported shoplifting in 2018 returned to average or below-average levels in 2020.
In Los Angeles, the average yearly reported shoplifting rate fell 46.9%% during the pandemic (from 2019 to 2021)—a drop very similar to the 42.7%% decrease observed in Chicago in the same period. The number of reported shoplifting incidents in the downtown area (F), which had previously been a large and extremely concentrated cluster of reported shoplifting, decreased by 75.4%. Reported incidents in area E decreased by 85.2% (see Figure 8 and Table 5).
Some places in Los Angeles that had previously been concentrated areas of reported shoplifting, such as area H, dropped to near-average levels of shoplifting during this time and were no longer classified as concentrated shoplifting clusters. Area F, much like area A in Chicago, decreased in the number of reported shoplifting incidents but increased in concentration of retail outlets (from 1,390 outlets per square mile in 2018 to 1,693 in 2020). Although there was less reported shoplifting in the city during the pandemic, and in area F specifically, areas with relatively high concentrations of shoplifting became more tightly concentrated around places with high concentrations of retail outlets.
Figure 8. Concentration of Reported Shoplifting in Los Angeles, 2020
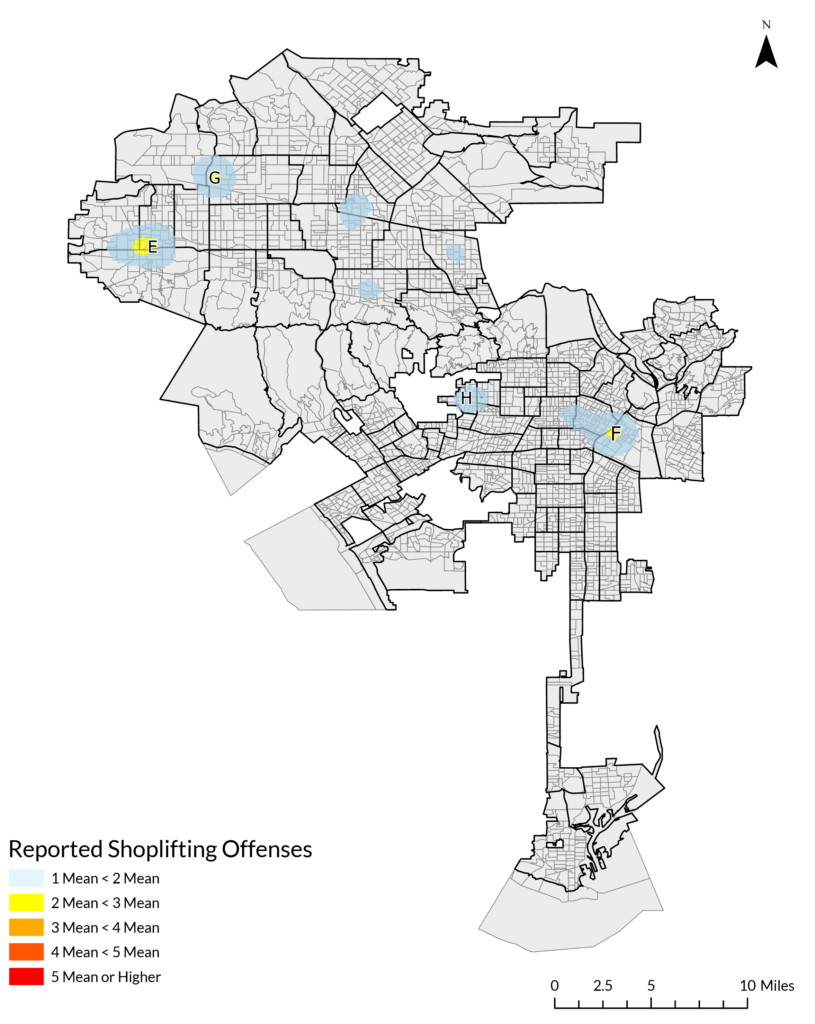
Table 5. Reported Shoplifting and Retail Outlets in Los Angeles, 2020
Changes in Reported Shoplifting Post-COVID
In Los Angeles, the rate and number of reported shoplifting incidents were 77% higher in 2023 than in 2018. In area F, the number of incidents increased by 33.2% compared to 2018, and in area E, incidents increased by 7.4%. See Table 6 for additional information.
Table 6. Reported Shoplifting and Retail Outlets in Los Angeles, 2023
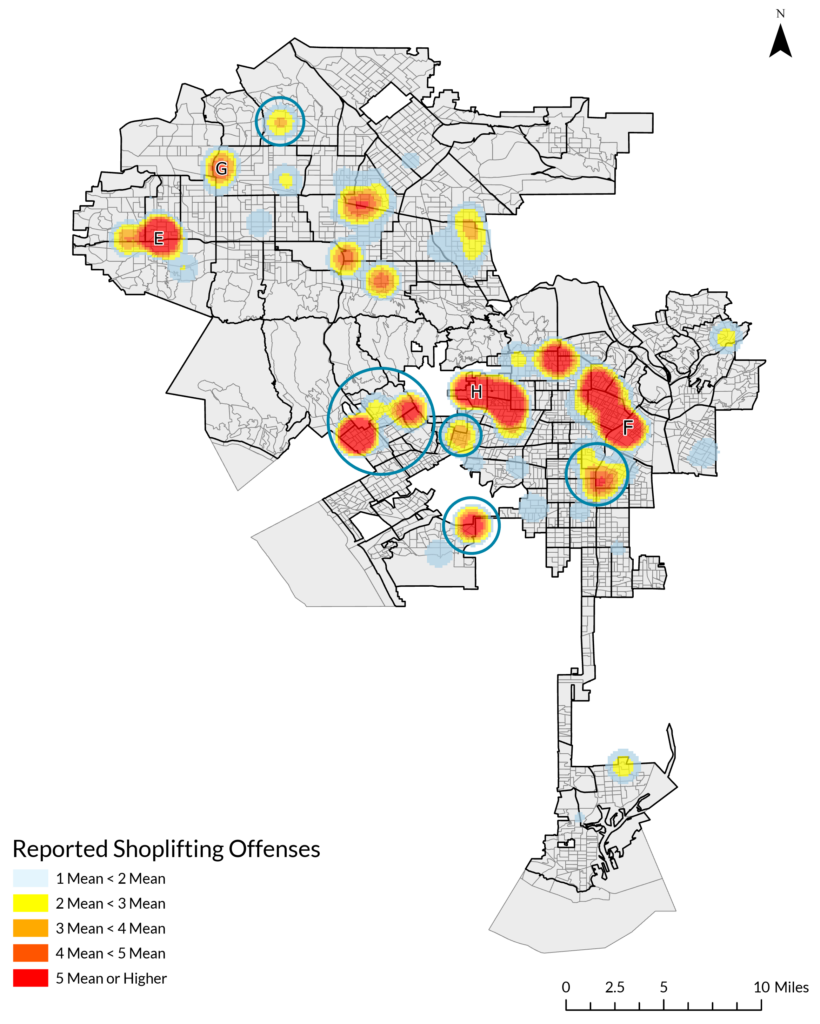
Reported shoplifting grew in intensity in several other locations as well. New high-shoplifting clusters emerged in 2023 in areas that, prior to 2020, had experienced average or just above-average levels of reported shoplifting (circled in Figure 9). Areas in Panorama City/Van Nuys, Westwood/Century City/West LA, Sawtelle, Westchester, Historic South-Central/Vermont Square/South Park, and Mid-Wilshire/Hancock Park were areas where shoplifting was around or lower than the city average-average places for reported shoplifting incidents in 2018 and 2019. In 2022 and 2023, they became very concentrated areas of reported shoplifting. For example, a small area in the Westchester neighborhood that reported only six shoplifting incidents in 2018 reported 347 in 2023. A 3.7-square-mile stretch of the Historic South-Central, South Park, University Park, Exposition Park, Adams-Normandie, and Vermont Square neighborhoods had 73 reported shoplifting incidents in 2018 and 498 in 2023.
Figure 9. Concentration of Reported Shoplifting in Los Angeles, 2023
Supplementary Analysis
In addition to the analysis of dynamic shoplifting clusters, statistical regression models were used to determine if reported shoplifting patterns remained stable over time across larger areas (census tracts). Census tracts vary in size, but each tract contains an average of 4,000 residents. The analyses found that although counts of reported shoplifting changed significantly over time, each census tract’s relative share of the city’s total reported shoplifting remained stable over time in both Chicago and Los Angeles. See the supplemental methodology report for details on the regression analysis.
Relative to other types of offenses, reported shoplifting was generally highly concentrated in both cities. This is likely because shoplifting can only occur if a retail outlet is present, while most other crimes do not require a retail location. Given that retail outlets are geographically concentrated in Chicago and Los Angeles, shoplifting is as well.
Violent crime and other forms of property crime were far more dispersed than reported shoplifting in both cities. As a result, other offenses were often found at high levels in areas with low levels of shoplifting. However, clusters of concentrated shoplifting generally occurred in places that also had high levels of other offenses. Both cities had few areas where reported shoplifting was prevalent but other crimes were not. Places with large amounts of reported shoplifting typically also experienced levels of violent crime (homicide, aggravated assault, robbery), burglary, theft (excluding reported shoplifting), and motor vehicle theft at levels above the average for that city. See the supplemental methodology report for offense-specific tables.
Conclusion
This study examines reported shoplifting patterns in Chicago and Los Angeles before, during, and after the COVID-19 pandemic. Although popular narrative has suggested that reported shoplifting is at all-time highs nationwide,1 this report and the previous CCJ report on shoplifting trends reinforce the idea that reported shoplifting trends vary by city and local context. Some cities, such as Chicago, had lower rates of reported shoplifting by year-end 2023 than in 2018. However, several cities, including New York and Los Angeles, had levels of reported shoplifting that were higher after the pandemic than they had been in 2018. For the most up-to-date shoplifting trends, please visit CCJ’s most recent crime trends report.
As cities began to implement COVID-19 restrictions in 2020 and 2021, consumer and business behavior shifted accordingly and rates of reported shoplifting declined in many places, including Chicago and Los Angeles. This study suggests that increases in reported shoplifting may be occurring in areas within cities where, prior to the COVID-19 pandemic, reported shoplifting was relatively low. As such, one potential explanation for public perceptions that shoplifting is rising may be that some specific areas in cities are experiencing higher levels of shoplifting than previously occurred in these places. Another explanation may be that reporting for shoplifting is incomplete and does not accurately represent the number of offenses that occur.2 As such, data on reported shoplifting may not reflect actual changes in shoplifting behavior.
This report also finds that for the cities in this analysis, concentrated areas of reported shoplifting are relatively small and located at large concentrations of retail outlets. However, some areas with large numbers of businesses experience average or below-average amounts of reported shoplifting. Responses to shoplifting should be tailored and selective, and policymakers and law officials should strategically prioritize the smallest geographic locations that experience the highest levels of reported shoplifting to maximize resources and intervention impacts.
Study Limitations
This study has several limitations. First, the shoplifting data used here are for reported shoplifting incidents only. Second, this report is largely a descriptive account of reported shoplifting in only two major American cities, Chicago and Los Angeles. Local factors and context likely heavily influence reported shoplifting and other offenses differently across cities. As a result, the findings of this report may not hold true in other cities.
A third limitation is that the retail location data used in this report do not account for different types of retail outlets, providing only an estimate of the number of retail outlets in an area. For example, a small neighborhood convenience store or bodega would be counted the same as a multilevel department store. These different kinds of retail outlets likely experience significantly different amounts of reported shoplifting. Additionally, data limitations required some degree of estimation regarding whether a business was in operation for a given year. See the supplemental methodology report for more information.
Appendix
Figure A1. Chicago Neighborhoods
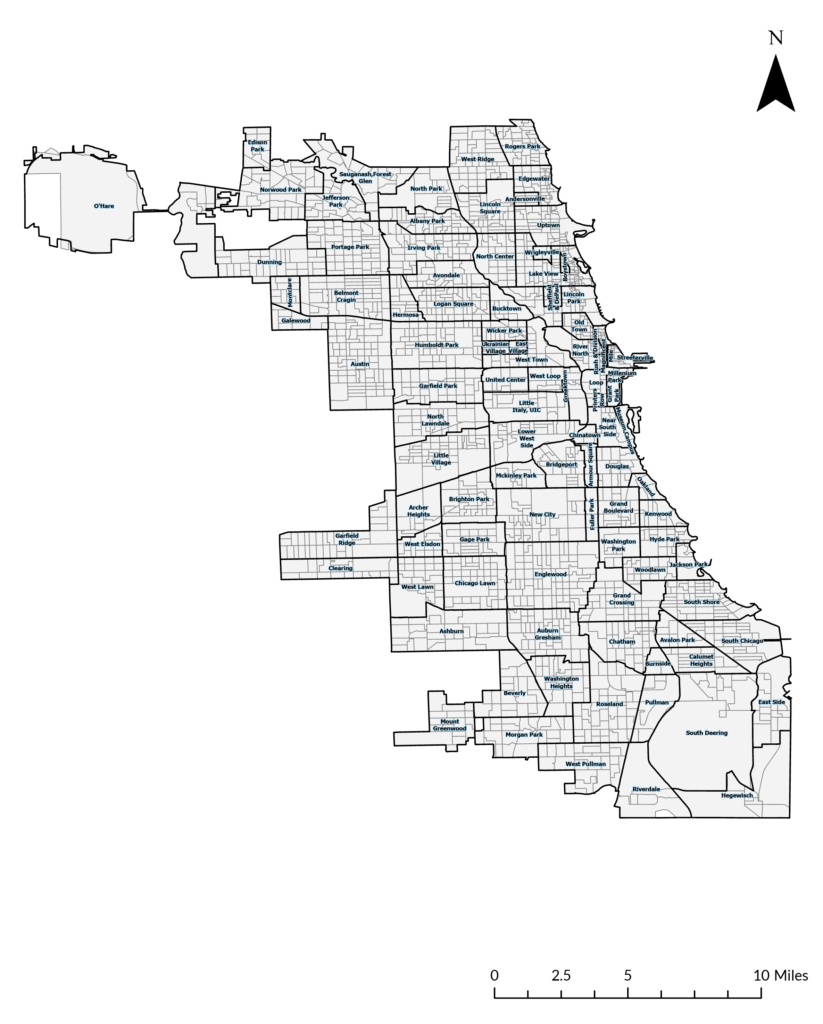
Figure A2. Los Angeles Neighborhoods
Acknowledgements
This paper was produced as part of the work of the CCJ Crime Trends Working Group with support from the Annie E. Casey Foundation, Arnold Ventures, the Harry Frank Guggenheim Foundation, Southern Company Foundation, Stand Together, and CCJ’s general operating contributors.
Suggested Citation
Boxerman, B., & Cundiff, K. (2024). Shoplifting Trends in Time and Space: A Study of Two Major American Cities. Council on Criminal Justice. https://counciloncj.org/shoplifting-trends-in-time-and-space-a-study-of-two-major-american-cities/
Endnotes
1 Lopez, G. (2023, November, 29). Is shoplifting really surging? New York Times. https://www.nytimes.com/2023/11/29/briefing/shoplifting-data.html
2 Hall, J. (2024). Deciphering retail theft data: implications and actions for policymakers. Manhattan Institute. https://manhattan.institute/article/deciphering-retail-theft-data


