Shoplifting Trends: What You Need to Know
November 2023
Ernesto Lopez | Robert Boxerman | Kelsey Cundiff
Introduction
Since shortly after the onset of the COVID-19 pandemic, the Council on Criminal Justice has tracked changing rates of violent and property crime in large cities across the United States. The pandemic, as well as the social justice protests during the summer of 2020 and other factors, have altered the motives, means, and opportunities to commit crimes.
Retail theft, especially organized retail theft, has received extensive media coverage and has caught the attention of state and federal policymakers. Dozens of shoplifting and “smash and grab” incidents in a variety of cities have been captured on video and have gone viral on social and mass media.1 Major grocers, drugstores, and other retail outlets have cited shoplifting as their reason for closing multiple locations and placing goods behind counters and in locked cases.2 California allocated $267 million in 2023 to a new initiative to combat retail thefts.3 In June 2023, the House Judiciary Subcommittee on Crime and Federal Government Surveillance held a hearing on incidents of organized retail theft.4
Prepared for the Council on Criminal Justice’s Crime Trends Working Group, this report focuses on trends in shoplifting, a subset of retail theft which, in turn, is a subset of overall larceny-theft. The FBI defines larceny-theft as the unlawful taking of property without force, violence, or fraud.
The report looks at shoplifting patterns from before the onset of the COVID-19 pandemic through mid-year 2023. To date, attempts to measure changes in retail theft, including organized retail theft, have relied on retail industry data5 or have been limited to one state.6
The city-specific data included in this report are drawn from open-data sources from 24 cities that, over the past five years, have consistently reported specific shoplifting data. Additional data come from the U.S. Justice Department’s National Incident-Based Reporting Program (NIBRS).7 The NIBRS data include a sample of 3,812 local law enforcement agencies. The analyses examine the changing frequency of reported shoplifting, trends in other property offenses, changes in the value of stolen goods, offenses that co-occur with shoplifting, and the number of people involved in each incident.
This report does not discuss in detail shoplifting data from the National Retail Federation’s Retail Security Survey.8 The 2021 survey (data ending in 2020) was the last year the survey reported figures on the number of incidents and the value of stolen goods. Because of this change, data from the survey could not be included.
Due to a lack of available data, this report does not examine factors that could be influencing the trends. Potential factors include changes in retailers’ anti-theft measures and changes in how retailers report shoplifting to law enforcement, which could be based on their perceptions of the extent to which local police or prosecutors will apprehend suspects and pursue criminal charges. Because these data rely on reported incidents, they almost certainly undercount total shoplifting. The findings presented here should be viewed with these considerations in mind.
Acknowledgements
This report was produced with support from the Annie E. Casey Foundation, Arnold Ventures, the Harry Frank Guggenheim Foundation, Stand Together Trust, and Southern Company Foundation, as well as the John D. and Catherine T. MacArthur Foundation and other CCJ general operating contributors.
Crime Trends Working Group
In Spring 2023, the Council on Criminal Justice (CCJ) launched the Crime Trends Working Group, a diverse panel of expert producers and consumers of criminal justice statistics. Its mission is to explore and explain current crime trends while building consensus for significant improvements in the nation’s capacity to produce timely, accurate, and complete crime data. The Working Group collects real-time crime data, identifies gaps in data collection and availability, and develops strategies to improve crime reporting nationwide as law enforcement agencies transition to a new federal reporting system.
Key Takeaways
- Shoplifting incidents reported to police have rebounded since falling dramatically in 24 large American cities during 2020. But whether the overall tally is up or down compared with pre-pandemic levels depends on the inclusion of New York City. With New York’s numbers included, reported incidents were 16% higher (8,453 more incidents) in the study cities during the first half of 2023 compared to the first half of 2019; without New York, the number was 7% lower (-2,552 incidents).
- New York (64%) and Los Angeles (61%) had the largest increases in reported shoplifting among the study cities from mid-year 2019 to mid-year 2023. St. Petersburg (-78%) and St. Paul (-65%) had the largest decreases.
- Comparing the most recent trends, from the first halves of 2022 and 2023, Los Angeles (109%) and Dallas (73%) experienced the largest increases among the study cities; San Francisco (-35%) and Seattle (-31%) saw the largest decreases.
- Shoplifting generally followed the same patterns as other acquisitive crimes (except motor vehicle theft) over the past five years, according to the FBI’s national data. But unlike other types of larcenies, shoplifting rates remained below pre-pandemic levels through 2022.
- The median value of goods stolen in shoplifting incidents grew from approximately $75 in 2019 to roughly $100 in 2021. Looking at 90% of incidents and excluding those in the top 10% in terms of value, the value of stolen goods in shoplifting incidents in 2021 was $756 or less, a $184 increase from 2019.
- The share of shoplifting incidents categorized as felonies (in five of the cities) nearly doubled from about 8% prior to the onset of the pandemic to almost 16% in the first half of 2023. (State statutes set felony theft dollar thresholds.)
- More than 95% of shoplifting incidents in 2019, 2020, and 2021 involved one or two people and 0.1% (or one out of 1,000) involved more than six people. But the share of cases lacking information on the number of people increased from 16% in 2019 to more than 25% in 2021.
- The proportion of reported shoplifting incidents that involved an assault or other crime rose 9% from 2019 to 2021 but constitutes a small share (less than 2%) of overall shoplifting events. Store assaults were 7% lower in the first half of 2023 compared to the first half of 2022 but were 8% higher for the same period compared to 2019.
Is there more reported shoplifting now than before the pandemic? Did rates of shoplifting vary across cities?
Figure 1 displays the average monthly reported shoplifting rate from 2018 to 2023 across the 24 cities that have consistently provided shoplifting data over the past five years. During this period, shoplifting rates varied from a low of 37.9 offenses per 100,000 population (February 2018) to a high of 48.1 (December 2019). There was a substantial drop in reported shoplifting from January 2020 to June 2020 (-37%) during the height of the COVID-19 pandemic and associated lockdowns. Reported shoplifting rates increased from July to December 2020 as some businesses reopened, but remained far below 2018 and 2019 levels. Consistent with seasonal trends, shoplifting incidents dropped again in January 2021, with February 2021 seeing the lowest average reported shoplifting rate in the study period (28.9 per 100,000).
Figure 1. Average Reported Shoplifting Rate, January 2018 – June 2023
Figure 2 shows monthly shoplifting rates for the entire 24-city sample. Whether a city experienced a decrease, increase, or no change in reported shoplifting rates from 2018 to 2023 does not appear to be related to its geographic location. For example, three West Coast cities experienced three different trends. Seattle had a moderate decline. After a large spike from September 2021 to April 2022, San Francisco returned to pre-pandemic levels. Los Angeles has seen increased shoplifting rates since the summer of 2021. In Texas, while Austin experienced a gradual, minor decline in reported shoplifting from 2018 to 2023, Dallas saw a slight increase during the time period.
Figure 2. Monthly Shoplifting Rate by City, January 2018 – June 2023
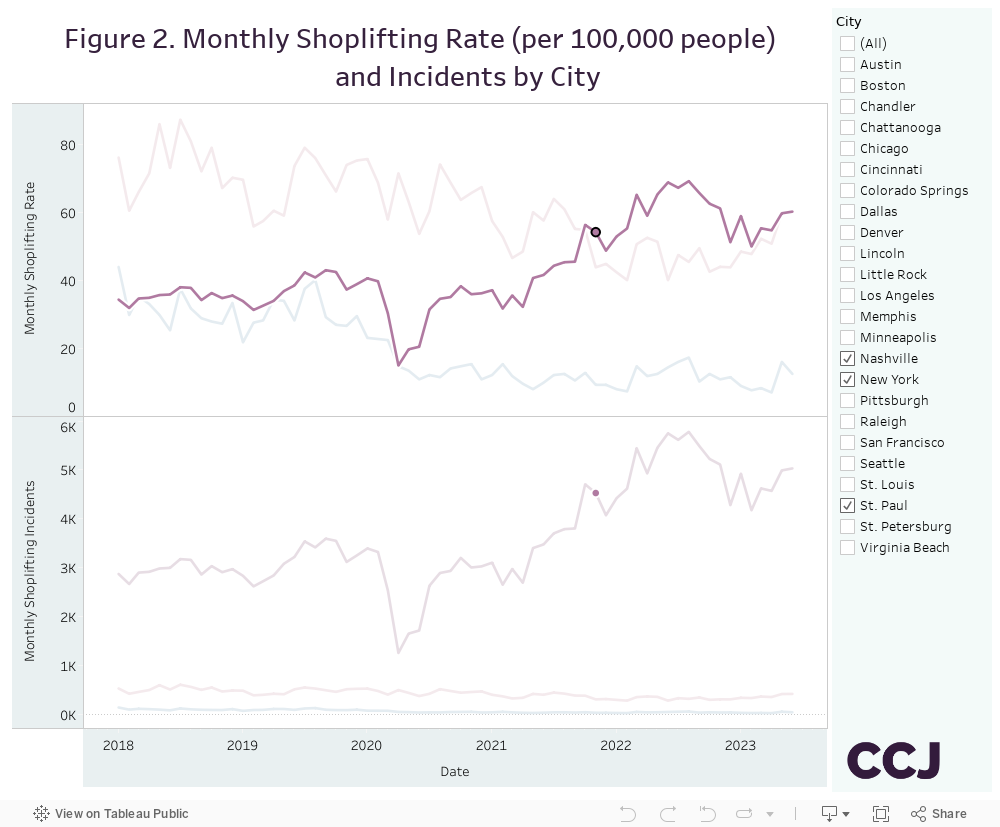
Figure 3 displays the percentage change in shoplifting from the first half of 2019 to the first half of 2023 for all cities. Two of the largest cities in the sample, New York and Los Angeles, also experienced the largest shoplifting increases during this period. During the first half of 2019, there were 17,311 shoplifting incidents in New York, well below the 28,316 incidents reported in the first half of 2023. In Los Angeles, there were 3,518 shoplifting incidents in the first half of 2019 compared to 5,662 in the first half of 2023. There were 61,184 shoplifting incidents across all 24 cities during the first half of 2023. New York accounted for 46% of those incidents.
Note: Changes in reported shoplifting rates may reflect changes in actual incidents of shoplifting, changes in whether and how often retailers or others report shoplifting to law enforcement, or other factors.
Figure 4 shows the total number of reported shoplifting incidents from January 2018 to June 2023 for the 24 cities. There were 110,764 reported incidents in 2019, and 119,758 incidents in 2022, an increase of 8%. In the first half of 2023, there were 61,184 shoplifting incidents. In the first half of 2018 and 2019, there were 52,874 and 52,731 shoplifting incidents, respectively. Compared to the first half of 2019, total shoplifting incidents were 16% higher (8,453 more reported incidents) in 2023 across the 24 study cities. The trend changes, however, when New York City is removed from the sample. Without data from New York, there are fewer incidents across the remaining 23 cities in 2022 compared to both 2018 and 2019. There are also about 7% (or 2,552) fewer shoplifting incidents in the remaining 23 cities during the first half of 2023 compared to the first half of 2019.
While New York was driving the increase in 2022, the first half of 2023 is a different picture. Compared to the first half of 2022, shoplifting was 17% higher across all study cities in the first half of 2023 and 8% lower in New York. This means other cities experienced increased shoplifting in 2023, while New York’s numbers decreased relative to 2022. Additionally, prior trends indicate that shoplifting tends to rise during the second half of the year compared to the first half. Thus, it is likely that multiple cities in the sample may have higher levels of shoplifting at the end of 2023 when compared to 2022.d
These trends in shoplifting paint a complex picture. Although several cities experienced higher shoplifting levels in the first half of 2023 compared to the first half of 2019, the number of shoplifting incidents in these cities was dwarfed by the number of incidents in New York City. Additional data from New York state show that reported larceny levels (including shoplifting) increased statewide from 2000 to 2022, and that New York City had the highest reported levels of larceny and a notable increase compared to the rest of the state (see Figure S1 in the supplemental methodology report for details).
Are shoplifting trends different from other property crime trends?
While this report focuses on shoplifting, examining other property crime trends can help put the shoplifting changes in context. Figure 5 displays the average monthly larceny and non-shoplifting larceny rates across the 24 cities. Shoplifting offenses constituted roughly 20% of all larcenies throughout the study period. While some of the decrease in larceny can be attributed to a drop in shoplifting, non-shoplifting larcenies independently decreased at the onset of the pandemic. Both non-shoplifting larceny and shoplifting likely dropped significantly due to COVID-19 community restrictions, store closures, and decreased foot traffic in the commercial and other establishments that remained open.9
Figure 5. Average Larceny and Non-Shoplifting Rates in 24 Cities, January 2018 – June 2023
Property crime levels vary significantly by crime type. For instance, from 2018 to 2023, there were about 2,000 more larcenies than robberies in an average month for the 24-city sample. This makes comparing the changes in levels difficult across multiple offenses in one graph. The offenses can be indexed to have the same starting point to overcome this obstacle. While some property offenses may have more seasonal variation than others, excluding any major changes, the trend lines should move together.
Figure 6 shows the percentage increase or decrease in select property offenses from January 2018. Each observation (month) can be interpreted as a percentage above or below the average rate in January 2018. The figure below shows the pre-pandemic seasonality of these offenses during 2018 and 2019. Although, there is still some seasonality after March 2020, relative shoplifting levels are generally lower than burglary or robbery until the beginning of 2022. The motor vehicle theft trend follows a similar pattern, as shown in the Council’s 2023 mid-year crime trends report.Shoplifting remained notably lower than non-shoplifting larcenies from the onset of the pandemic through 2022.
Figure 6: Percentage Change in Average Offense Rates in 24 Cities, January 2018 – June 2023
Applying the same indexing approach as Figure 6, Figure 7 shows the changes in property crime, including shoplifting, for New York, Los Angeles, and Virginia Beach – the three cities with the largest increases (see Figure 3). In all three cities, shoplifting did not follow the same pattern as other property offenses.
Like the national trends displayed in Figure 6, in New York City patterns in different types of property crime displayed some seasonal variation before the pandemic. Beginning in 2020, shoplifting diverged slightly from other larcenies and, in the summer of 2021, shoplifting began to deviate from other property offenses. By the spring of 2022, shoplifting in New York was elevated compared to most other property crimes and to previous shoplifting levels.
In Los Angeles, by contrast, there is no clear seasonality, and shoplifting decreased and stayed well below other property offenses beginning in early 2020. By June 2022, however, shoplifting rates returned to typical levels and continued to climb. After the initial pandemic drop, shoplifting and other larcenies in Los Angeles followed similar trends until January 2023, when other larcenies dropped and shoplifting continued to climb.
In Virginia Beach, there is also no clear seasonal pattern, and shoplifting dropped modestly from March 2020 to March 2021. Beginning in April 2021, however, shoplifting mostly trended upward through June 2023. In early 2023, shoplifting rates were higher than other property crime rates compared to January 2018.
The recent increase in reported shoplifting incidents compared to other property crimes is unusual and deserves additional exploration. Typically, levels of these offenses move together because the motivation to commit them is the same. If the motivation is financial, then it is likely that levels of non-shoplifting property crimes would be either the same or higher than shoplifting because other property offenses tend to yield higher-valued goods. FBI data show that shoplifting produces the lowest average value of stolen goods among all other property offenses. Additional information on the value of stolen items can be found in Figure S3 and Table S3 located in the supplemental methodology report.
It is possible that the growth in incidents in the three cities with the largest increases could be related to shoplifting “specialists,” such as those highlighted by New York City Mayor Eric Adams earlier this year.10 A small group of individuals committing a large share of offenses is a common finding in criminological research11 However, it is unclear why a group of specialists would drive such a large increase during this period compared to the pre-pandemic period. Bail reform is one possible explanation, yet the timing of the reform (at least in New York) does not align with the shoplifting increase, and research suggests that bail reform likely has no association with increased larceny.12
Another possibility is a change in the rate at which stores report shoplifting to police. This analysis is based solely on reported shoplifting incidents; the underreporting of shoplifting has yet to be systematically analyzed. However, data from the Anaheim (California) Police Department indicate that a major retailer reported 8% of shoplifting incidents in 2022 and 20% in 2023.13 According to one report, a spike in San Francisco shoplifting may have resulted from increased reporting.14 If retailers in some cities increased reporting, then that would increase the count of shoplifting offenses even if there was no actual increase. Researchers can use the National Crime Victimization Survey (NCVS) to gauge if reporting levels have changed for crimes that involve people or their possessions.15 But businesses are not included in the NCVS sample. In addition, the National Retail Security Survey does not provide data on the share of incidents reported to police.16
Has the value of stolen goods increased?
The number of reported shoplifting incidents is only one measure of the scope of shoplifting. Anecdotal evidence suggests that recent shoplifting incidents involve individuals stealing more valuable goods or a larger volume of goods than before.17 Some news accounts have shown people filling bags or shopping carts full of items and walking out.18 Both NIBRS and the city-level data show an increase in the value of stolen goods from 2018 and 2019.
Figure 8 shows the percentage of the dollar value (in 2022 dollars) of 50%, 75%, and 90% of shoplifting incidents from 2019 to 2021 as measured in the FBI’s national database, NIBRS. These percentiles are used for two reasons. First, the average (mean) value can be skewed by a few incidents with extremely large values. For this reason, the median, which is the middlemost value, is commonly used to describe financial data. Second, using percentiles helps visualize the share of shoplifting incidents by dollar value. Thus, Figure 8 provides information on the most typical cases and not extreme, uncommon events.
In 2019, the median value of stolen goods nationally was $74. For that same year, 90% of stolen goods were valued at $572 or less and the value of stolen goods exceeded $572 in 10% of shoplifting incidents. As shown in Figure 8, the trends for 50%, 75%, and 90% of shoplifting incidents were similar across years. However, the total value of shoplifting incidents dropped from $129.2 million in 2019 to $119.3 million in 2020, and then rebounded to $129.3 million in 2021. While the total value of shoplifted goods was essentially equal in 2019 and 2021, there were 92,000 fewer incidents in 2021. In 2021, the typical value of stolen goods in shoplifting incidents increased; for example, in 90% of shoplifting incidents in 2021, the value of stolen goods was $756 or less, a $184 increase from 2019. Please refer to the supplemental methodology report for additional details.
Figure 8: Value of Shoplifted Goods by Percentiles
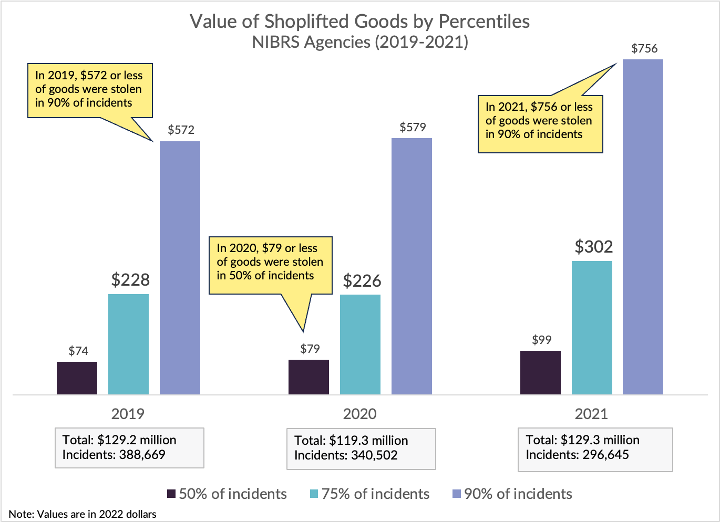
Note: At the time of this analysis, NIBRS data were only available through 2021.
The value of shoplifted merchandise also can be viewed by the share of shoplifting incidents that exceed the state’s statutory threshold for felony theft. Figure 9 displays the share of shoplifting cases classified as felonies. The percentage of felony shoplifting incidents fluctuated between 7% and 9% in 2018 and 2019 and dropped sharply to 3% in April 2020. After that dip, the share of felony shoplifting incidents continued to increase with some minor variation through June 2023. These data are available for only five of the 24 cities in the sample and should be interpreted with caution.
Figure 9. Proportion of Shoplifting Categorized as Felony Offenses, January 2018 – June 2023
Note: Because of data availability, only New York, Los Angeles, San Francisco, Memphis, and St. Paul are included in this analysis
Overall, the results suggest that the value of shoplifting incidents has increased since 2019. This is demonstrated by the NIBRS results and supported by the increased share of felony shoplifting incidents. Since the NIBRS results are generated using percentiles, the results are largely unaffected by extreme cases (e.g., those in the tens of thousands of dollars).
It should also be noted that there is some inconsistency between the NIBRS data and industry sources. According to retail industry data, the average (mean) shoplifting incident value was $461.86 in 2020, and had increased by 71% compared to 2019.19 The NIBRS data, however, showed that a shoplifting incident’s average (mean) value in 2020 was $275. As noted above, the mean is not used for the analysis due to because extremely high-value large shoplifting incidents providing an unrepresentative picture of most shoplifting incidents.
Has violence increased with shoplifting?
From 2020 to 2021, the number of news stories covering smash-and-grab incidents nearly doubled.20 Some media reports have covered incidents involving mobs of people who ransacked a store and fled, and retail industry surveys show that employee and customer safety from violence has become a major retailer concern.21 NIBRS data permits examination of whether shoplifting is associated with the commission of other violent crimes, including homicide and assault, or other property crimes such as vehicle theft and vandalism.
Table 1 shows the number of shoplifting incidents and both the number and percent of other offenses that co-occurred during a shoplifting incident. So-called “smash-and-grab” tactics associated with shoplifting are classified as vandalism. The share of shoplifting incidents that involve vandalism remained consistent from 2019 to 2021 at around 0.56% (or one out of 200 incidents). The proportion of shoplifting incidents that included either a simple assault or another serious crime (i.e., non-vandalism) increased from 1.07% in 2019 to 1.25% in 2021. The percentage of shoplifting incidents that involved an aggravated assault increased from 0.16% to 0.23% from 2019 to 2021, and the share of simple assaults also increased from 0.68% to 0.78% for the same period. Overall, the percentage of total companion offenses increased from 1.63% to 1.80%, with the largest percentage increase in assault offenses. While the total number of assaults decreased from 2019 to 2021, the percentage increased as a result of about 92,000 fewer shoplifting incidents in 2021 compared to 2019.
Table 1. The Number and Percentage of Companion Offenses with a Shoplifting Incident
2019 | 2020 | 2021 | |||||
|---|---|---|---|---|---|---|---|
Percentage of Companion Offenses | 1.63% | 1.77% | 1.80% | ||||
Offense | Number | Percentage | Number | Percentage | Number | Percentage | |
Shoplifting | 392,818 | 344,581 | 300,277 | ||||
Homicide | 0 | 0.00% | 0 | 0.00% | 1 | 0.00% | |
Rape | 0 | 0.00% | 3 | 0.00% | 0 | 0.00% | |
Robbery | 272 | 0.07% | 206 | 0.06% | 228 | 0.08% | |
Aggravated Assault | 646 | 0.16% | 676 | 0.20% | 695 | 0.23% | |
Burglary | 530 | 0.13% | 617 | 0.18% | 376 | 0.13% | |
Simple Assault | 2,652 | 0.68% | 2,551 | 0.74% | 2,349 | 0.78% | |
Vehicle Theft | 109 | 0.03% | 93 | 0.03% | 96 | 0.03% | |
Vandalism | 2,207 | 0.56% | 1,957 | 0.57% | 1,670 | 0.56% | |
Figure 10 shows the number and percent of assaults (simple and aggravated) that occurred at a retail location by year. The eight cities included in the sample reported 10,024 assaults in retail stores in 2019 and 11,273 in 2022. These data include all reported assaults that occurred in a retail location and are not limited to assaults co-occurring with a shoplifting incident. From January 2018 to June 2023, assaults in retail stores accounted for approximately 4.4% to 5% of total reported assaults. Store assaults were 7% lower in the first half of 2023 compared to the first half of 2022. But they were 8% higher for the same period compared to 2019 (not shown). Values for 2023 were only available through June. The number of assaults is not displayed for 2023 as data do not cover the entire year.
Figure 10: Percentage and Number of Store Assaults in Eight Cities, January 2018 – June 2023
Are shoplifting "mobs" increasing?
Widely circulated footage of large crowds of people running from stores with armfuls of goods has raised questions about whether such “mob” shoplifting events are on the rise. A lack of available data makes a definitive answer impossible, but the information available does show that the vast majority of shoplifting is not committed by groups.
Table 2 shows that more than 95% of shoplifting incidents in 2019, 2020, and 2021 that were committed by a known number of individuals involved one or two people. Approximately 0.1% (or one out of 1,000) shoplifting incidents involved more than six people during these three years. But a proportion of cases lack information on the number of people involved, and that share is growing. It increased from 16% in 2019 to more than 25% in 2021. The increase in missing offender information could reflect a change in the number of involved individuals, but the data do not allow further exploration. The level of missing information is further discussed in the supplemental methodology report.
Table 2: Number of Individuals per Shoplifting Incident
1 | 2 | 3–5 | 6–10 | 11 or more | Missing Information | |
|---|---|---|---|---|---|---|
2019 | 78.3% | 17.1% | 4.4% | 0.11% | 0.00% | 15.7% |
2020 | 79.0% | 17.0% | 3.9% | 0.10% | 0.00% | 18.5% |
2021 | 80.3% | 16.2% | 3.4% | 0.09% | 0.00% | 25.3% |
Note: Percentages for the numerical categories were calculated using incidents with the known number of offenders as the denominator.
Study Limitations
This study has several limitations. First, crime incident data is not suited to measure organizational retail theft. Organized retail theft is an investigative determination – rather than a reported offense type in official sources – and therefore it cannot be reliably extracted from crime data. Second, the analyses presented here may not represent shoplifting trends across the United States. The NIBRS analyses mostly cover smaller cities, while the analyses using data directly from police departments are limited to some of the largest police agencies. Nevertheless, the two sources illustrate similar patterns.
The third and largest limitation is that retail industry measures may have influenced the results. Retailers taking action to combat shoplifting (e.g., removing goods from the floor, locking items in cabinets) have undoubtedly prevented some crimes. At the same time, if retailers were reporting shoplifting to law enforcement more often than in the past, that would increase the number of offenses and influence the findings. Without detailed information on the specific anti-shoplifting measures or reporting procedures taken by the retail industry, it is difficult to determine whether and how these practices affected the results.
About the Authors
Ernesto Lopez is a Research Specialist with the Council on Criminal Justice and co-author of the crime trends reports produced by CCJ since early in the pandemic.
Robert Boxerman, is a Graduate Research Assistant and the University of Missouri-St. Louis.
Kelsey Cundiff is an Assistant Professor in the Department of Criminology and Criminal Justice at the University of Missouri-St. Louis.
The authors would like to thank CCJ Policy Specialist Liza Bayless for her research assistance.
Glossary
The offense-specific definitions are based on NIBRS and may slightly differ from city open-data sources. Organized retail theft is defined by combining key elements from multiple sources.
Aggravated Assault
An unlawful attack by one person upon another wherein the offender uses a weapon or displays it in a threatening manner, or the victim suffers obvious severe or aggravated bodily injury involving apparent broken bones, loss of teeth, possible internal injury, severe laceration, or loss of consciousness.
Burglary/Breaking and Entering
The unlawful entry into a building or other structure with the intent to commit a felony or a theft.
Destruction/Damage/Vandalism of Property (Except Arson)
To willfully or maliciously destroy, damage, deface, or otherwise injure real or personal property without the consent of the owner or the person having custody or control of it.
Larceny/Theft Offenses
The unlawful taking, carrying, leading, or riding away of property from the possession, or constructive possession, of another person.
Motor Vehicle Theft
The theft of a motor vehicle.
Murder and Nonnegligent Manslaughter
The willful (nonnegligent) killing of one human being by another.
Organized Retail Theft
Robbery
The taking, or attempting to take, anything of value under confrontational circumstances from the control, custody, or care of another person by force or threat of force or violence and/or by putting the victim in fear of immediate harm.
Simple Assault
An unlawful physical attack by one person upon another where neither the offender displays a weapon, nor the victim suffers obvious severe or aggravated bodily injury involving apparent broken bones, loss of teeth, possible internal injury, severe laceration, or loss of consciousness.
Shoplifting
The theft, by someone other than an employee of the victim, of goods or merchandise exposed for sale.
Shoplifting Rate
The number of reported shoplifting incidents per 100,000 city residents.
Endnotes
1 Hernandez, J. (2023, October 9). Videos of ‘flash mob’ thefts are everywhere, but are the incidents increasing? National Public Radio. https://www.npr.org/2023/10/09/1203697964/flash-mob-retail-thefts
2 Bennett, G., & Hastings, D. (2023, September 29). As retailers close stores due to shoplifting, are the concerns real or overblown? PBS News Hour. https://www.pbs.org/newshour/show/as-retailers-close-stores-due-to-shoplifting-are-the-concerns-real-or-overblown
3 Office of Governor Gavin Newsom. (2023, September 12). California to make largest-ever investment to combat organized retail crime. CA.GOV. https://www.gov.ca.gov/2023/09/12/ort-grants/
4 House of Representatives Judiciary Committee. (2023). The rise in organized retail crime and the threat to public safety. https://judiciary.house.gov/committee-activity/hearings/rise-organized-retail-crime-and-threat-public-safety
5 Capital One Shopping Research. (2023). Retail theft (shoplifting) statistics. https://capitaloneshopping.com/research/shoplifting-statistics/
6 Lofstrom, M, & Martin, B. (2023, September 7). Retail theft and robbery rates have risen across California. PPIC. https://www.ppic.org/blog/retail-theft-and-robbery-rates-have-risen-across-california/
7 Bureau of Justice Statistics. (2022). National incident-based reporting system (NIBRS). https://bjs.ojp.gov/national-incident-based-reporting-system-nibrs
8 National Retail Federation. (n.d.). National retail security survey. https://nrf.com/tag/national-retail-security-survey
9 Meyer, M., Hassafy, A., Lewis, G., Shrestha, P., Haviland, A. M., & Nagin, D. S. (2022). Changes in crime rates during the COVID-19 pandemic. Statistics &Public Policy, 9(1), 97-10. https://doi.org/10.1080/2330443X.2022.2071369
10 NYT: The Official Website of the City of New York. (2023, May 17). Mayor Adams announces plan to combat retail theft in New York City. https://www.nyc.gov/office-of-the-mayor/news/340-23/mayor-adams-plan-combat-retail-theft-new-york-city#/0
11 See, for example: Moffitt, T. E. (1993). Adolescence-limited and life-course-persistent antisocial behavior: A developmental taxonomy. Psychological Review, 100(4), 674–701. https://doi.org/10.1037/0033-295X.100.4.674
12 Wu, S., & McDowall, D. (2023). Does Bail Reform Increase Crime in New York State: Evidence from Interrupted Time-Series Analyses and Synthetic Control Methods. Justice Quarterly, 1-29. https://doi.org/10.1080/07418825.2023.2209145
13 Harrell, K. (2023). Anaheim police department. https://www.bscc.ca.gov/wp-content/uploads/2-Anaheim-Police-Dept.pdf
14 Neilson, S, & Swan, R. (2021, November 27). One Target store. One huge spike in shoplifting reports. What does it mean for San Francisco. San Francisco Chronicle. https://www.sfchronicle.com/sf/article/shoplifting-data-Target-Walgreens-16647769.php
15 Bureau of Justice Statistics. (2009). National crime victimization survey. https://bjs.ojp.gov/data-collection/ncvs
16 National Retail Federation. (2023). National retail security survey 2023. https://nrf.com/research/national-retail-security-survey-2023
17 Guzman, F. (2023, April 13). Video shows more than 30 people steal $300,000 worth of items at Nordstrom in Los Angeles. USA Today. https://www.usatoday.com/story/news/nation/2023/08/13/nordstrom-robbery-los-angeles-california/70584637007/
18 Reilly, P. (2023, July 26). Shoplifting suspects casually roll out three carts of merch from California Burlington store: video. New York Post. https://nypost.com/2023/07/26/shoplifting-suspects-casually-roll-out-three-carts-of-goods-from-california-burlington-store-video/
19 Capital One Shopping Research. (2023). Retail theft (shoplifting) statistics. https://capitaloneshopping.com/research/shoplifting-statistics/
20 Bennett, L., Mendoza, N., Perelmuter, B., & Shapiro, M. (2023). Retail theft: What to know and where to go. The Center for Just Journalism. https://justjournalism.org/media/download/CJJ_TipSheet_RetailTheft_2022.pdf
21 National Retail Federation. (2023). National retail security survey 2023. https://nrf.com/research/national-retail-security-survey-2023