Crime Trends in U.S. Cities: Mid-Year 2023 Update
JULY 2023
Ernesto Lopez
Research Specialist, Council on Criminal Justice
Richard Rosenfeld
Chair, Council on Criminal Justice Crime Trends Working Group
Curators’ Distinguished Professor Emeritus of Criminology and Criminal Justice, University of Missouri-St. Louis
Bobby Boxerman
Graduate Research Assistant, University of Missouri-St. Louis
Note: A more up-to-date version of our crime trends report is now available. See the latest crime trends reports here.
Overview
- This study updates and supplements previous U.S. crime trends reports by the Council on Criminal Justice (CCJ) with additional crime data through June 2023. It examines monthly crime rates for 10 violent, property, and drug offenses in 37 American cities. The 37 cities are not necessarily representative of all cities in the United States. Not all cities reported data for each offense (see appendix), and the data used to measure the crime trends are subject to revision by local jurisdictions.
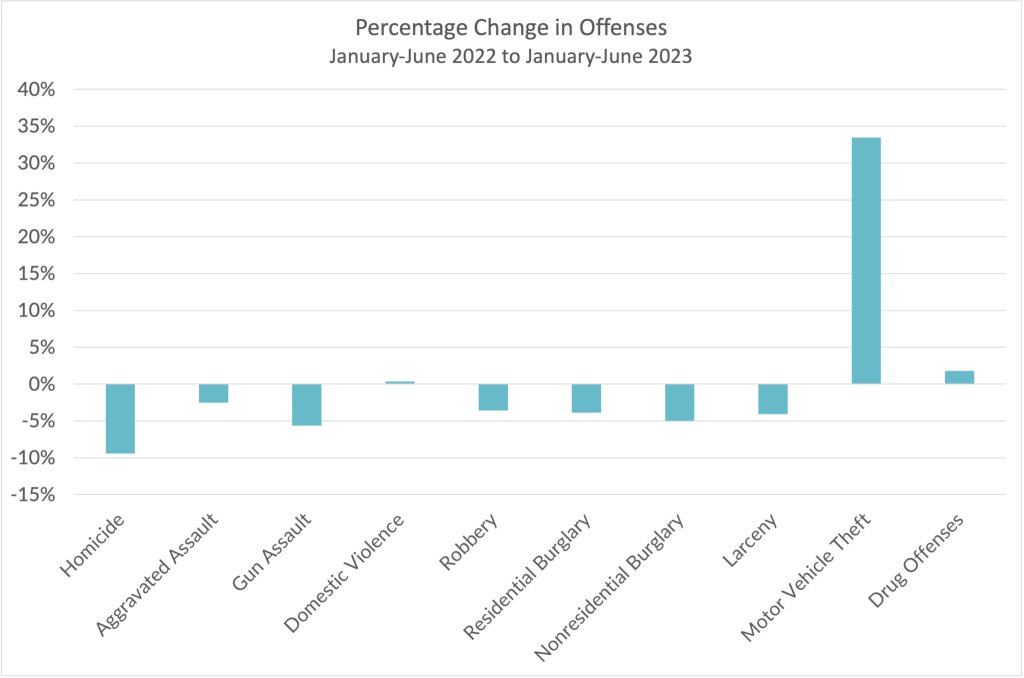
- The number of homicides in the 30 study cities providing homicide data was 9.4% lower—202 fewer homicides—during the first half of 2023 than in the first half of 2022.
- There were 2.5% fewer aggravated assaults in the first half of 2023 compared to the first half of 2022. The number of gun assaults also dropped (-5.6%) over the same period, but this trend is based on data from just 10 cities and should be viewed with caution.
- Robberies, residential burglaries, nonresidential burglaries, and larcenies all decreased in the first half of 2023 compared to the first half of 2022. Robberies fell by 3.6%, residential burglaries by 3.8%, nonresidential burglaries by 5%, and larcenies by 4.1%
- Motor vehicle thefts continued their upward trend through the first half of 2023.
There were 33.5% more motor vehicle thefts from January through June 2023 compared to the first half of 2022. The number of drug offenses increased by 1% over the same period.
- Domestic violence incidents increased by 0.3% in 11 cities during the first half of 2023 compared to the first half of 2022.
- Violent crimes remain elevated compared to 2019, the year prior to the COVID pandemic and racial justice protests of 2020. There were 24% more homicides during the first half of 2023 than during the first half of 2019 in the study cities. Property crime trends have been more mixed. There were fewer residential burglaries and larcenies and more nonresidential burglaries in the first half of 2023 than during the same period than four years earlier. Motor vehicle thefts more than doubled (+104%), while drug offenses fell by 39%.
- The authors conclude that crime patterns continue to shift as the nation has emerged from the COVID pandemic and that policymakers and communities must act urgently to adapt their strategies to meet the new challenges. Though the level of serious violent crime is far below historical peaks, it remains intolerably high, especially in poorer communities of color. Research has identified strategies that work to reduce violence and improve the fairness and effectiveness of policing. Intensive efforts on both fronts are essential to help cities achieve lasting reductions in homicide and other crime.
Introduction
This report updates CCJ’s previous studies of crime changes that began during the early months of the coronavirus pandemic, extending the analyses with data through June 2023. The 37 cities included in this study were selected based on data availability (see Appendix for full list). They range from Chattanooga, TN, the smallest, with 179,690 residents, to New York, the largest, with more than 8.4 million residents. The mean population of the cities for which crime data were available is approximately 900,000, while the median population is roughly 465,500.
This report assesses monthly changes between January 2018 and June 2023 for 10 crimes: homicide, aggravated assault, gun assault, domestic violence, robbery, residential burglary, nonresidential burglary, larceny, motor vehicle theft, and drug offenses. As in the previous reports, this analysis focuses special attention on the trend in homicides. The crime data were obtained from online portals of city police departments that provided monthly incident-level data for the period between January 2018 and June 2023. Offense counts were converted to monthly crime rates per 100,000 city residents for analysis of trends. Offense classifications varied somewhat across the cities, and not all cities reported data for each crime. The number of cities reporting crime data ranged from a high of 33 for robbery to a low of 10 for gun assaults. An appendix table shows how many cities reported data for each offense.
The crime incident data for this report were obtained within days of the end of the study period to provide a timely snapshot of crime across the nation.1 As a result, these figures may-and often do-differ from data subsequently published by individual police departments. The findings also may differ from other counts released later by the FBI, as part of its national crime reporting program. In addition, they may differ from those in previous CCJ reports because they are based on a different number and mix of cities. Finally, the city sample used for this report is not necessarily representative of all large American cities or the nation as a whole.
1 Efforts to compile crime data continued through July 12, 2023. Cities that had not posted June 2023 crime data on their websites by that date could not be included in this report.
KEY TAKEAWAY
This snapshot suggests that levels of most offenses are lower, or have changed little, in the first six months of 2023 compared with the same period in 2022. The most notable exception is the large increase in motor vehicle theft.
Changes in Violent Offenses
Homicide
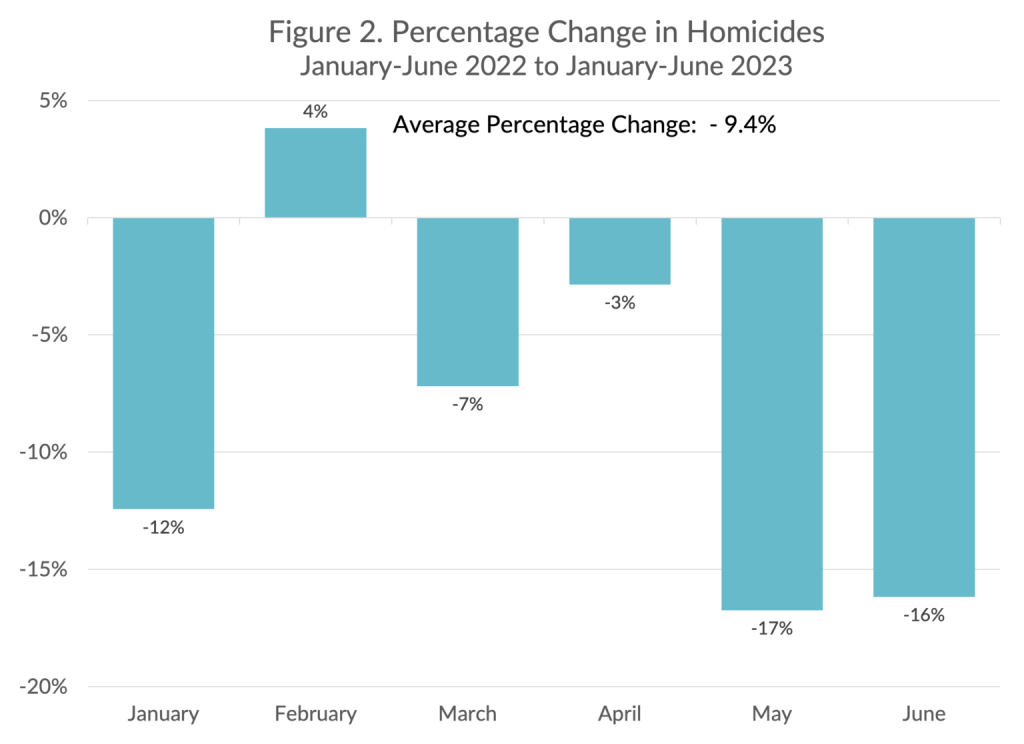
Homicide is the unlawful killing of one person by another. Figure 1 displays the average monthly homicide rate in the 30 cities for which homicide incident data were available (see Appendix). The analysis identified an upward-trending cyclical pattern in the homicide rate over time. The rate peaked in July 2020, far exceeding previous peaks during the study period, amid widespread protests against police violence after George Floyd’s murder in May of that year. By 2021, the homicide rate was 40.7% higher than in 2019. At year-end 2022, homicides were 5% lower than in 2021 and 33.7% higher than in 2019. The number of homicides during the first half of 2023 was 9.4% lower, on average, than during the same period in 2022—representing 202 fewer homicides in the cities that reported data (see Figure 2). Relative to 2022, May and June saw the largest decreases during the first half of 2023, with drops of 17% and 16%, respectively. Despite such declines, homicide levels remained 24% higher in the first half of 2023 than in the first half of 2019, the year before the pandemic, the police killing of George Floyd, and the ensuing protests.

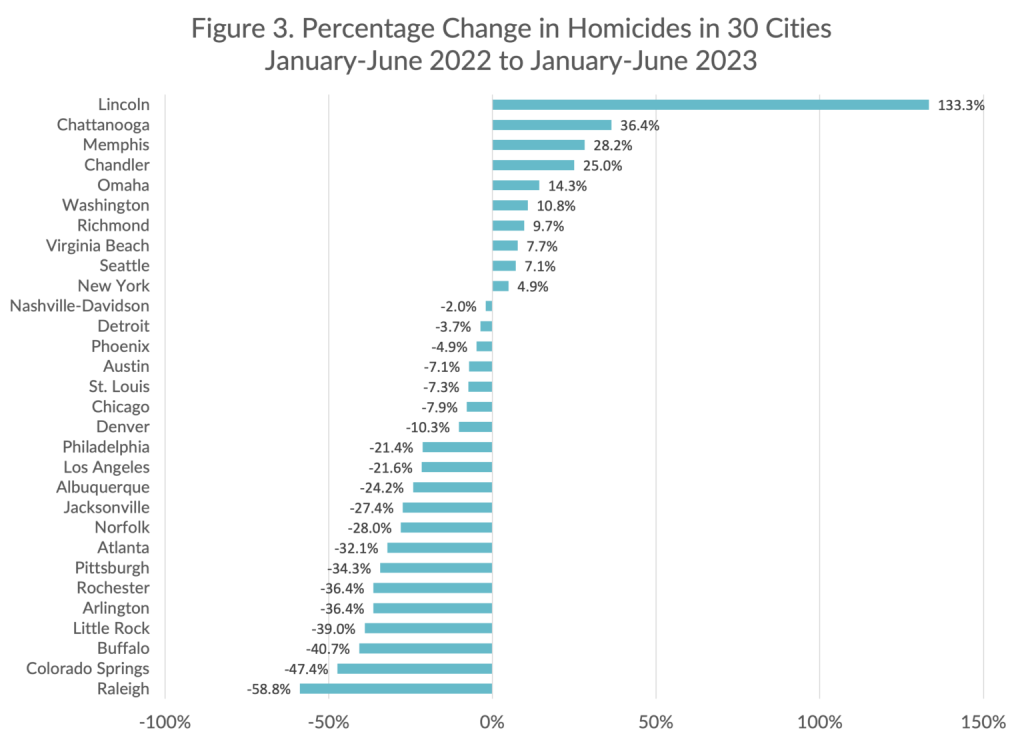
Not all cities followed the sample-wide trend in homicide. To illuminate the variation across the 30 cities included in this study, Figure 3 shows the percentage change in the number of homicides in each city for the period between January and June in 2022 and 2023. Ten of the cities recorded a rise in homicide, ranging from increases of 133% in Lincoln, NE, to less than 4.5% in New York. Twenty cities experienced reductions in homicides, ranging from 59% in Raleigh, NC, to 2% in Nashville, TN. (As noted above, crime incident data for individual cities are subject to revision. For the most up-to-date information on a specific city, please visit its website.)
KEY TAKEAWAY
The number of homicides was 9.4% lower—202 fewer homicides—during the first half of 2023 than in the first half of 2022. However, the homicide rate remained 24% higher than during the first half 2019, the year prior to the pandemic and protests.
Aggravated Assault
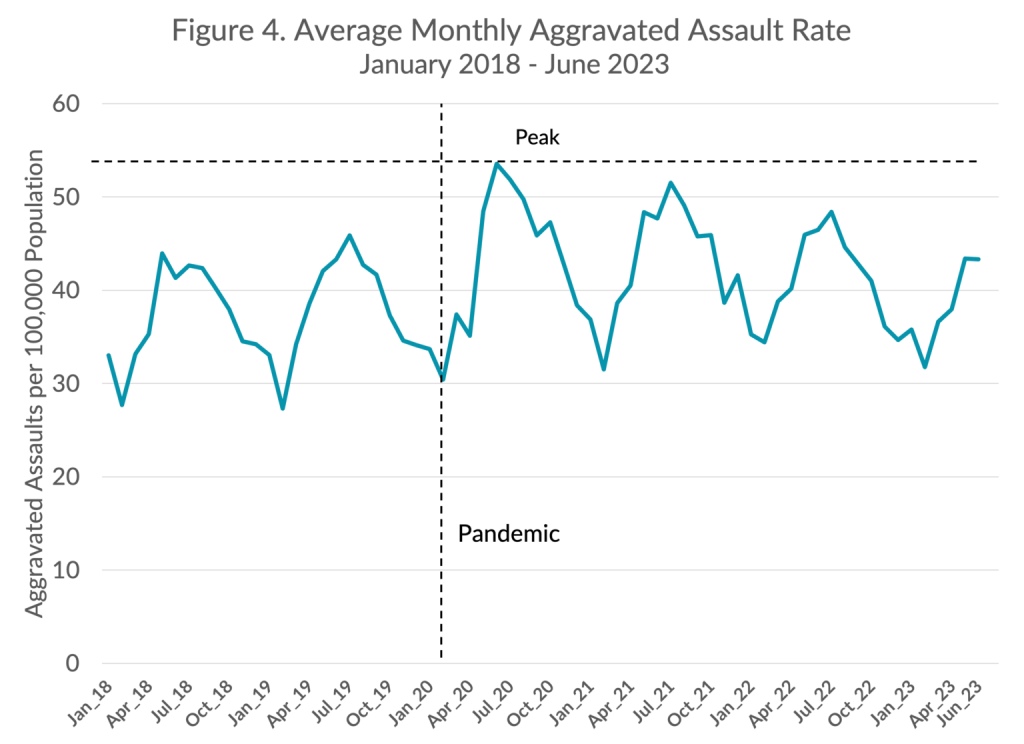
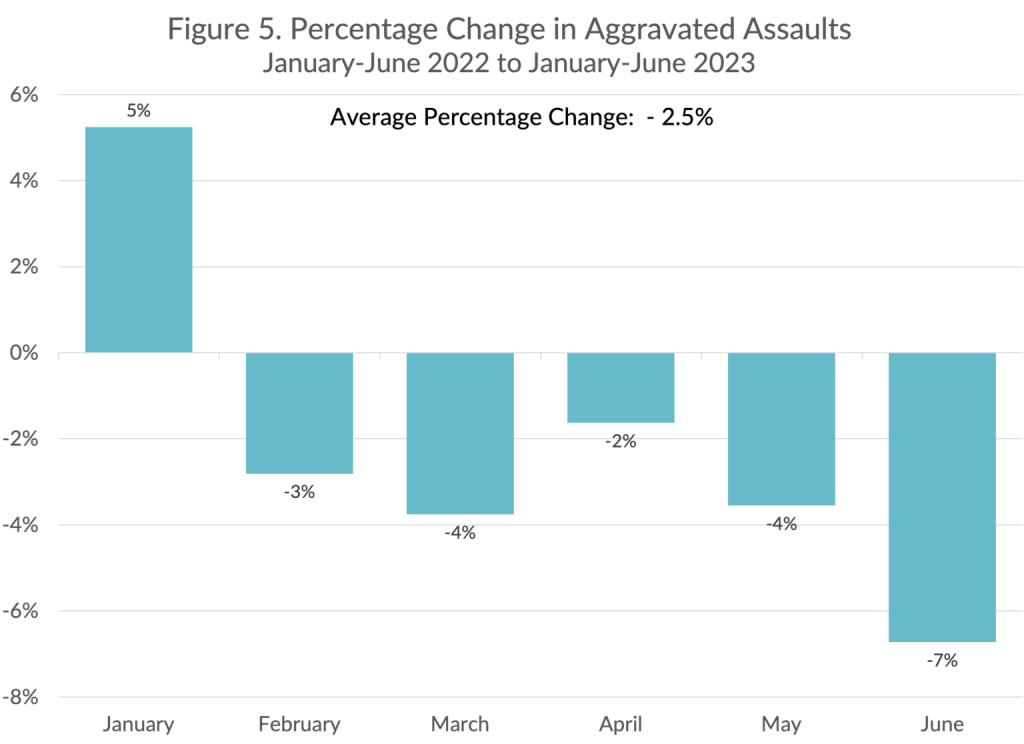
Aggravated assaults are assaults committed with a deadly weapon or those that result in or threaten serious bodily injury to the victim. As shown in Figure 4, the average monthly aggravated assault rate in the 25 cities with available data for that crime exhibited a clear cyclical pattern over time, rising during the late spring and summer of each year and falling during the fall and winter months. Like the homicide rate, the aggravated assault rate peaked during the summer of 2020 at levels that surpassed those of previous highs. Since that 2020 summer peak, aggravated assaults have moved closer to pre-pandemic levels. By year-end 2022, aggravated assaults were 3.3% lower than in 2021 and 8.7% higher than in 2019. The number of aggravated assaults during the first half of 2023 was 2.5% lower, on average, than during the same period in 2022, representing 978 fewer aggravated assaults in the cities that reported data (see Figure 5). The aggravated assault rate in the first half of 2023 remained 8% higher than in the first half of 2019.
KEY TAKEAWAY
The number of aggravated assaults was 2.5% lower—978 fewer aggravated assaults—during the first half of 2023 than in the first half of 2022. However, aggravated assaults in the first half of 2023 remained 8% higher compared to the first half 2019, the year prior to the pandemic and protests.
Gun Assault
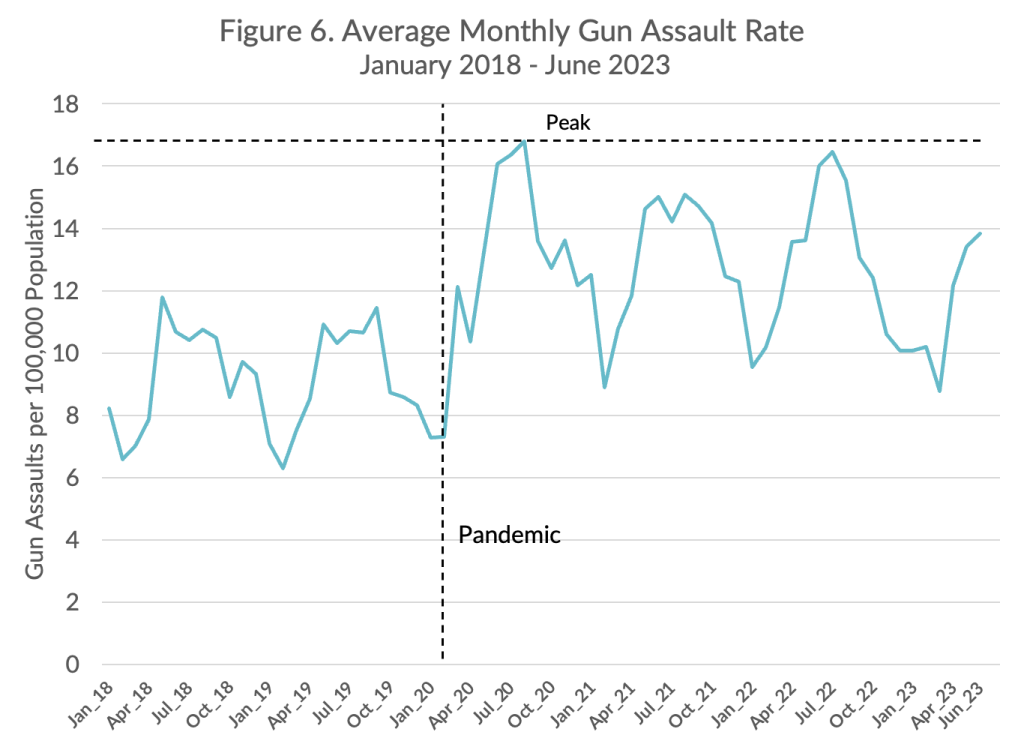
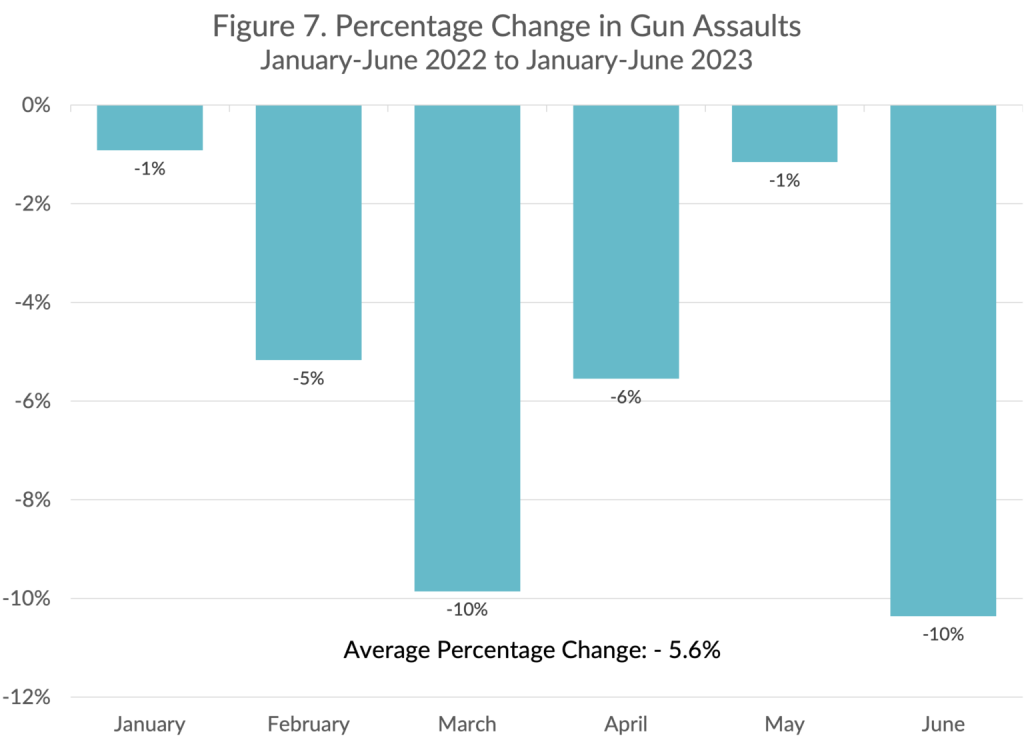
Gun assaults are aggravated assaults committed with a firearm. As shown in Figure 6, the monthly gun assault rate in the 10 cities with available data exhibited a cyclical trend over time. Similar to the homicide and aggravated assault rates, it peaked during the summer of 2020 and declined thereafter. Gun assaults fell by 4.8%, on average, from 2021 to 2022 in the study cities. However, gun assaults were still 43.2% higher in 2022 compared to 2019. As shown in Figure 7, the number of gun assaults during the first half of 2023 was 5.6% lower, on average, than during the same period in 2022, representing 514 fewer gun assaults in the cities that reported data. The gun assault rate from January to June 2023 was 39% higher than in the first half of 2019. Given the small number of cities on which these results are based, they should be viewed with caution.
Police agencies do not consistently report data on mass shootings, so these events are not included in this report. But other organizations collect such data from a variety of sources. The Associated Press and USA Today, in partnership with Northeastern University, have tracked mass killings—defined as an occurrence in which four or more people, not including the assailant, are slain within a 24-hour period. AP reported that during the first six months of 2023, the nation experienced 28 mass killings, all but one of which involved guns. This was the largest number of such events since the start of the data series in 2006.
KEY TAKEAWAY
The number of gun assaults was 5.6% lower—514 fewer gun assaults—during the first six months of 2023 than in the first six months of 2022. However, gun assaults for the first half of 2023 remained 39% higher compared to the first half of 2019, the year before the pandemic and protests. These results should be viewed with caution because they are based on data from just 10 cities.
Domestic Violence
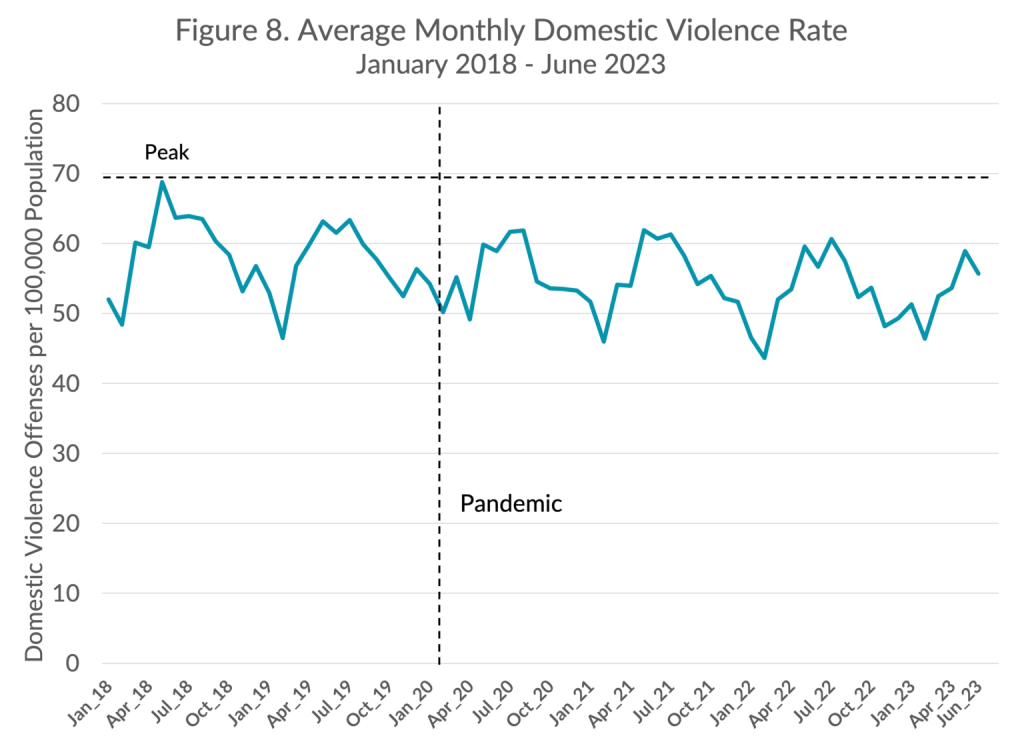
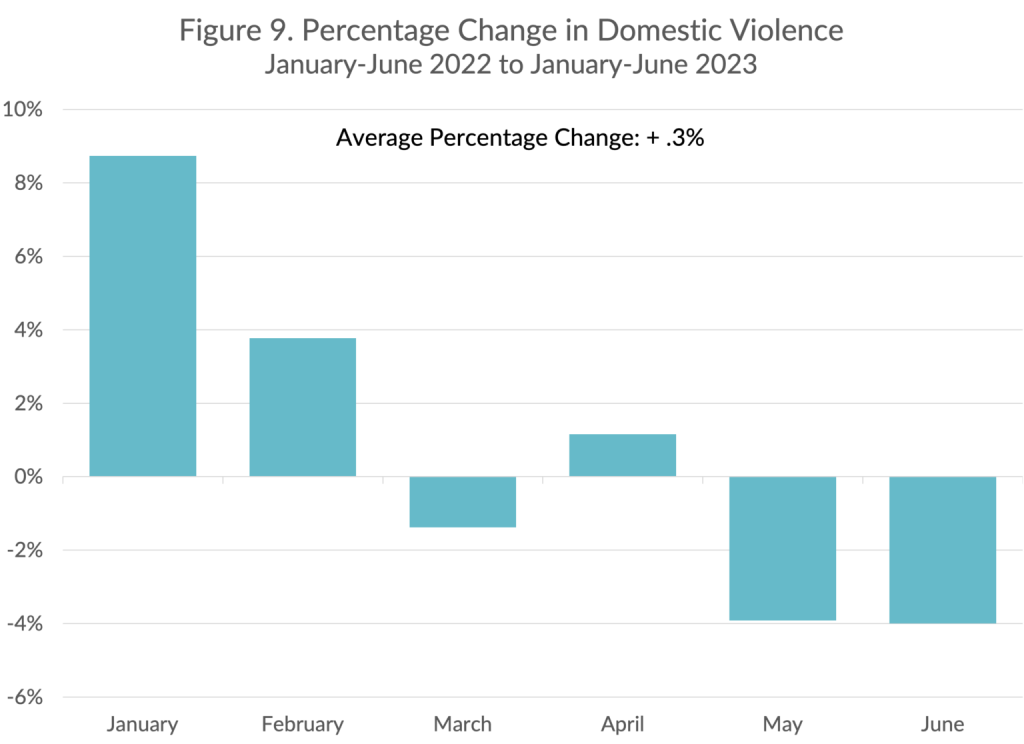
Domestic violence consists primarily of aggravated and so-called simple assaults committed against domestic partners or family members. The monthly domestic violence rate, displayed in Figure 8, exhibited a cyclical pattern and a small downward trend that persisted through the end of 2022. Across the sample of 11 cities, domestic violence decreased by 3.9% from 2021 to 2022. Domestic violence offenses were 5% lower in 2022 compared to 2019. The number of domestic violence offenses during the first half of 2023 was 0.3% higher, on average, than during the same period in 2022, representing 148 more domestic violence incidents in the cities that reported data (see Figure 9). The domestic violence rate from January to June 2023 remained 4.8% lower than in the first half of 2019. Please see CCJ’s systematic review of domestic violence for more information on domestic violence during the initial period of the pandemic and related lockdowns.
KEY TAKEAWAY
The number of domestic violence offenses was 0.3% higher—148 more offenses—during the first half of 2023 than in the first half of 2022. Domestic violence offenses remained 4.8% lower than in the first half of 2019, the year before the pandemic and protests. These results should be viewed with caution because they are based on data from just 11 cities.
Robbery
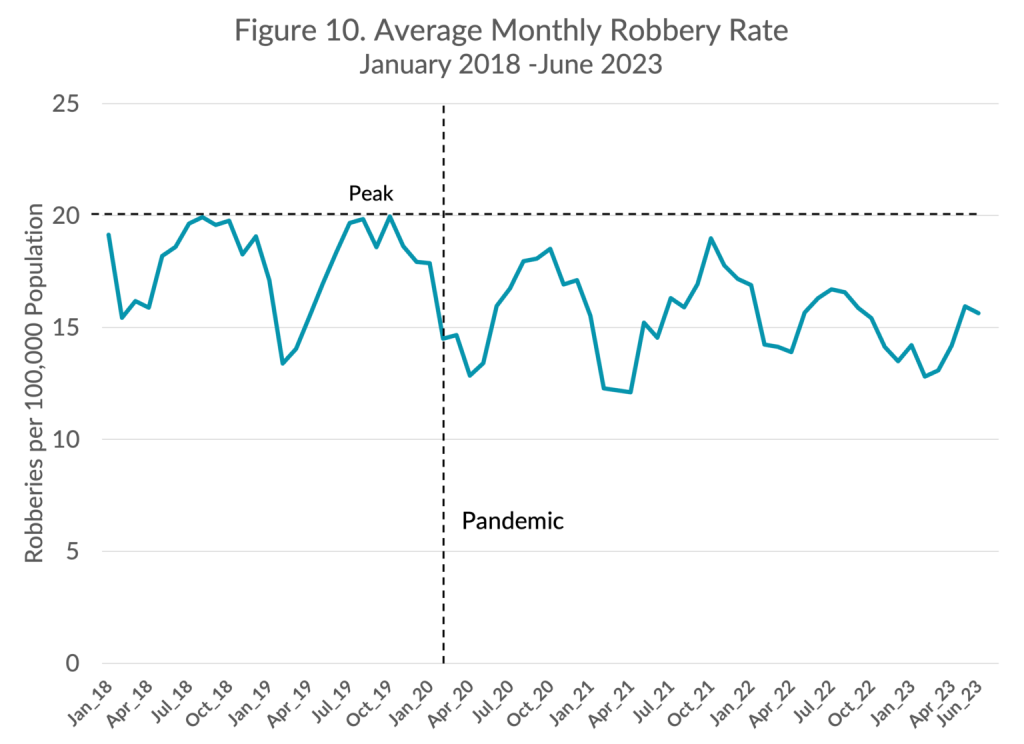
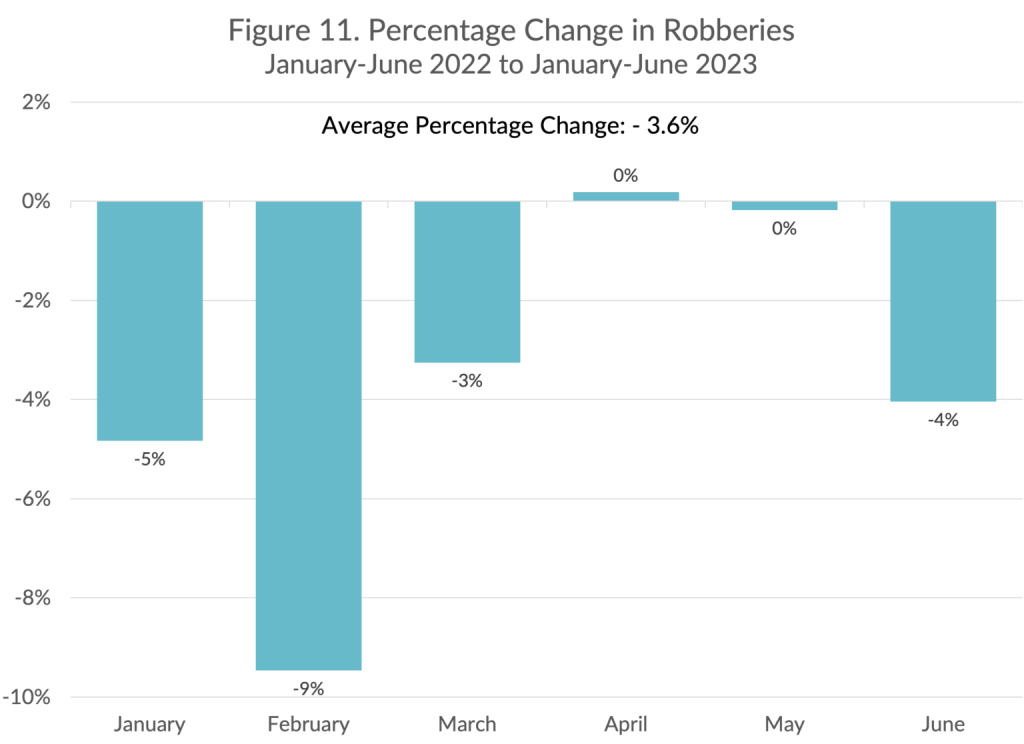
Robberies are thefts committed with force or the threat of force. The average monthly robbery rate in the 33 cities with available data was lower during the first two years of the pandemic than during the preceding two years, as shown in Figure 10. On average, robberies increased by 8.4% from 2021 to 2022 in the study cities. Yet, robberies were still 0.3% lower in 2022 compared to 2019. As shown in Figure 11, the number of robberies during the first half of 2023 was 3.6% lower, on average, than during the same period in 2022, representing 1,144 fewer robberies in the cities that reported data. Robberies were 2% higher during the first half of 2023 compared to the same period in 2019.
KEY TAKEAWAY
The number of robberies was 3.6% lower—1,144 fewer offenses—during the first half of 2023 than in the first half of 2022. However, they remained 2% higher compared to the first half of 2019, the year before the pandemic and protests.
Changes in Property and Drug Offenses
Residential Buglary
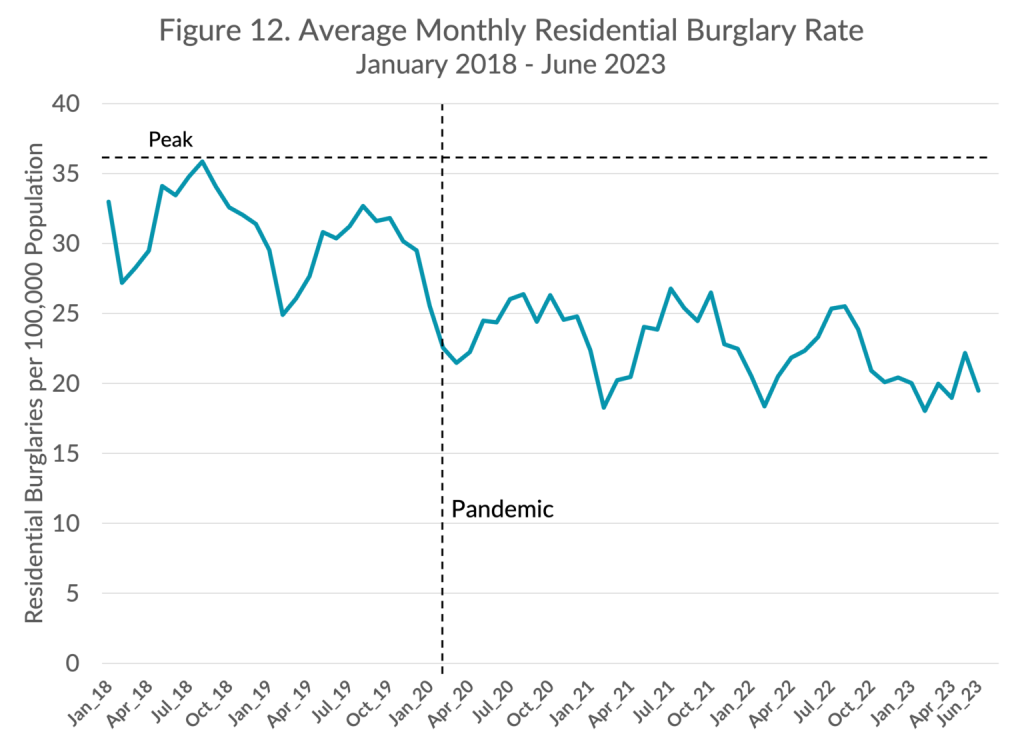
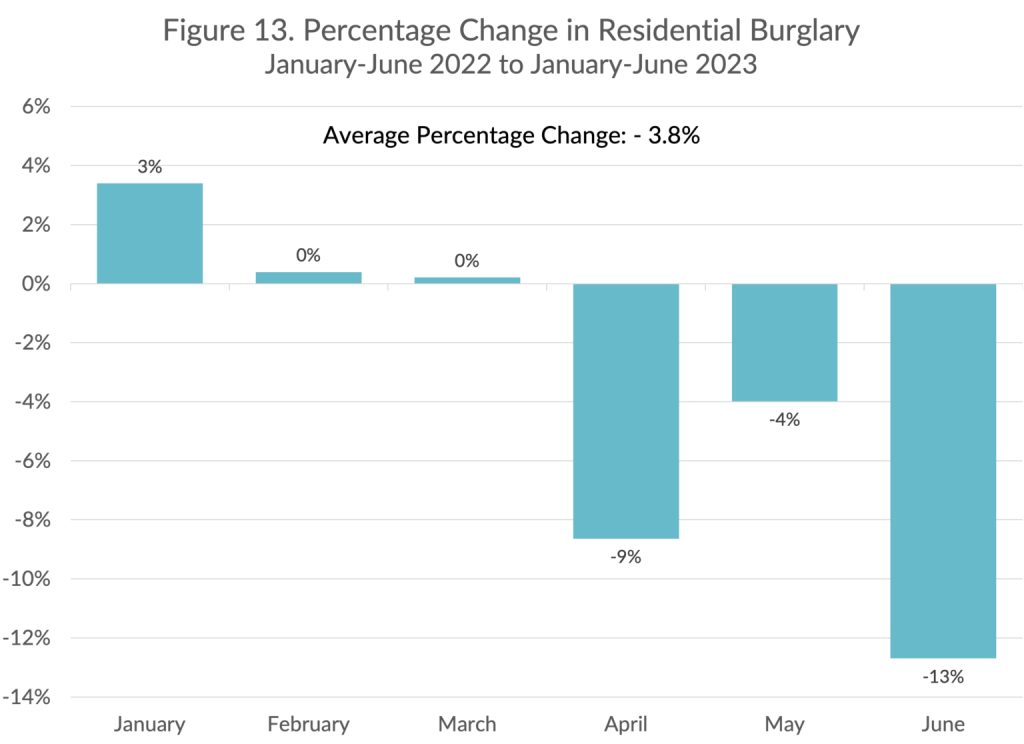
Burglaries involve breaking and entering a residential or commercial premise for the purpose of committing a crime. As shown in Figure 12, the average monthly residential burglary rate in the 16 cities with available data exhibited a downward cyclical trend over time. By the end of 2022, there were 0.2% fewer residential burglaries than in 2021 and 23.4% fewer than in 2019. That downward trend continued in the first half of 2023. The number of residential burglaries from January through June 2023 was 3.8% lower, on average, than during the same period in 2022, representing 680 fewer residential burglaries in the cities that reported data (see Figure 13). The number of residential burglaries from January to June 2023 remained 26% lower than in the first half of 2019.
KEY TAKEAWAY
The number of residential burglaries was 3.8% lower—680 fewer offenses—during the first half of 2023 than in the first half of 2022. They remained 26% lower than during the first half of 2019, the year before the pandemic and protests.
Nonresidential Buglary
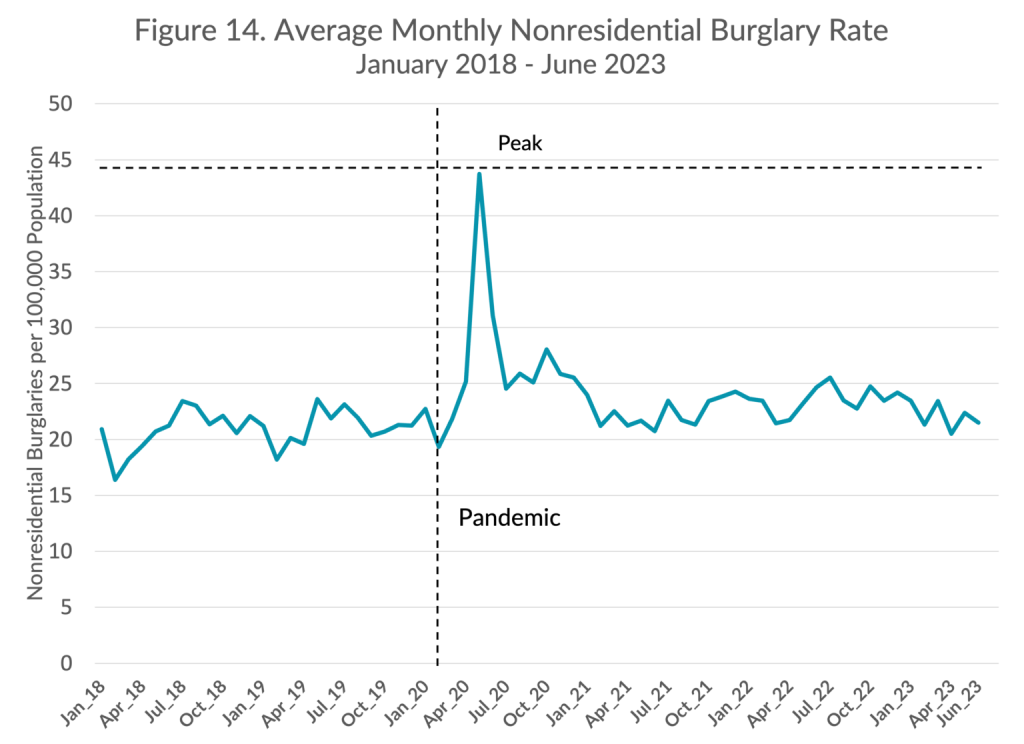
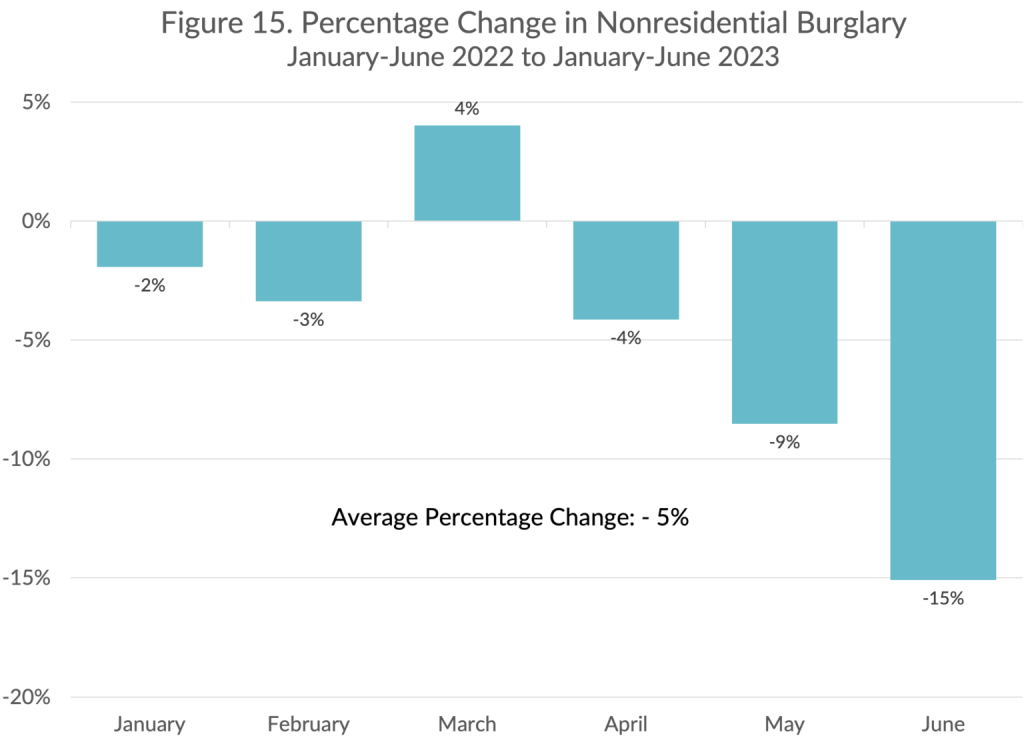
In the 16 cities with available data, the monthly nonresidential burglary rate exhibited a flat cyclical pattern before the pandemic. Shortly after the beginning of the pandemic, there was an abrupt and brief spike in May 2020, coinciding with protests over police violence. By the end of 2022, there were 6.5% more residential burglaries than in 2021 and 11.7% more than in 2019. The number of nonresidential burglaries during the first half of 2023 was 5% lower, on average, than during the same period in 2022, representing 1,021 fewer nonresidential burglaries in the cities that reported data (see Figure 15). The nonresidential burglary rate from January to June 2023 was 5.1% higher than in the first half of 2019.
KEY TAKEAWAY
The number of nonresidential burglaries was 5% lower—1,021 fewer offenses—during the first half of 2023 than in the first half of 2022. However, they remained 5.1% higher than during the first half of 2019, the year before the pandemic and protests.
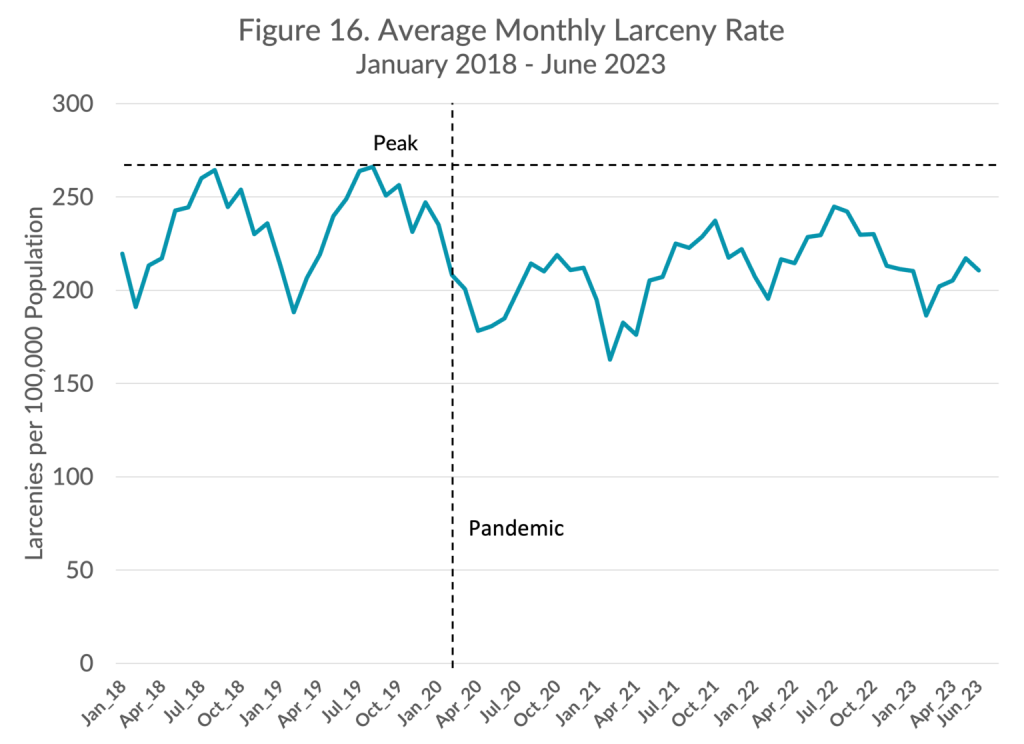
Larceny
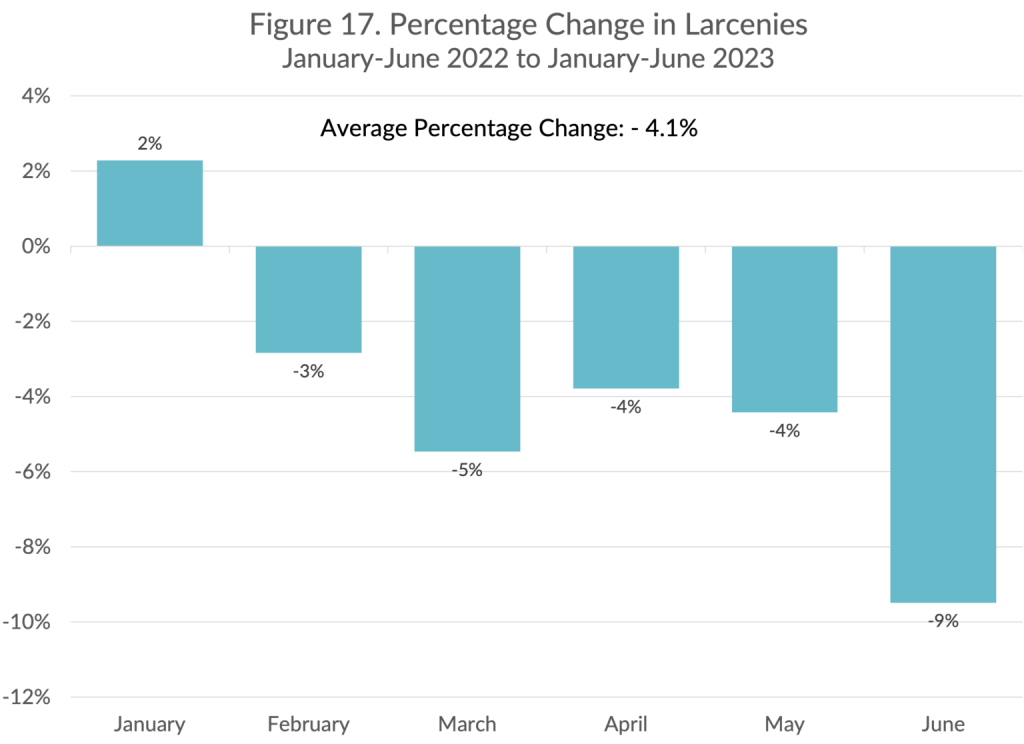
Larcenies are thefts unaccompanied by force or breaking and entering. Thefts from motor vehicles and shoplifting are the two most common forms of larceny. Data from 31 cities show that the average monthly larceny rate exhibited a distinct cyclical pattern over time, as shown in Figure 16. By the end of 2022, there were 9.9% more larcenies than in 2021 but 5.9% fewer than in 2019. The number of larcenies during the first half of 2023 was 4.1% lower, on average, than during the same period in 2022, representing 9,295 fewer larcenies in the cities that reported data (see Figure 17). The number of larcenies from January to June 2023 was 7% lower than in the first half of 2019.
KEY TAKEAWAY
The number of larcenies during the first half of 2023 was 4.1% lower on average than during the same period in 2022—9,295 fewer larcenies in the cities that reported data. However, they remained 7% lower than during the first half of 2019, the year before the pandemic and protests.
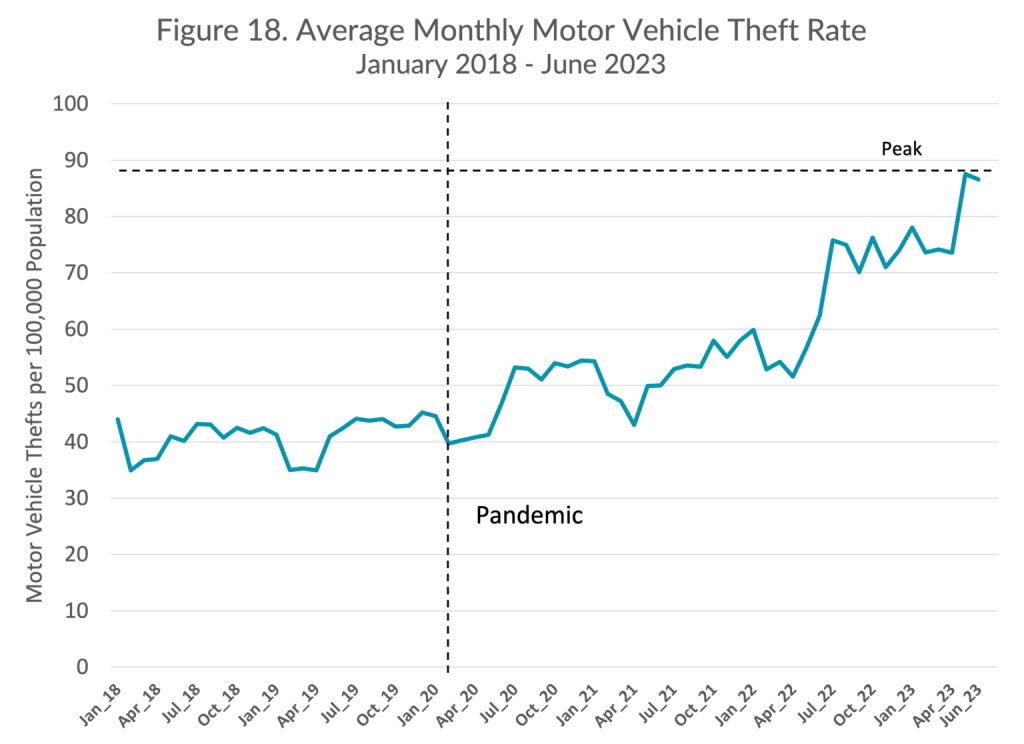
Motor Vehicle Theft
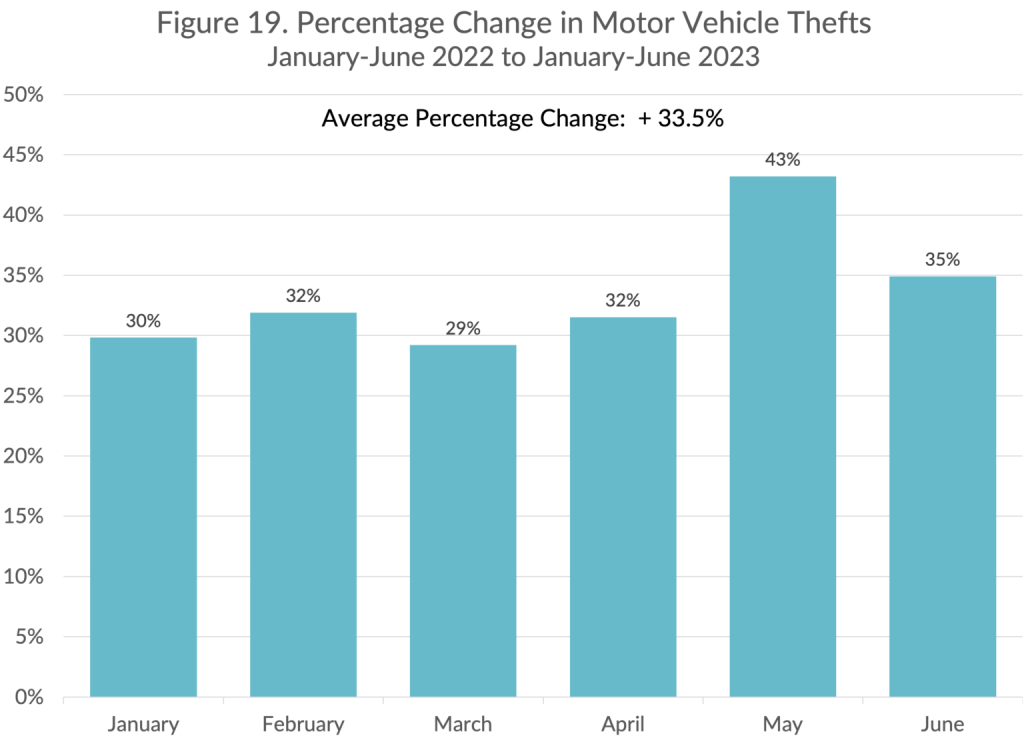
The average monthly motor vehicle theft rate rose and fell cyclically from January 2018 to March 2020 in the 32 cities with available data, as shown in Figure 18. It rose, with seasonal fluctuations, through April of 2022, and then increased substantially in the summer and fall of that year. By the end of 2022, there were 26.6% more motor vehicle thefts than in 2021 and 67.5% more than in 2019. The number of vehicle thefts during the first half of 2023 was 33.5% higher, on average, than during the same period in 2022—representing 23,974 more vehicle thefts in the cities that reported data (see Figure 19). The number of vehicle thefts from January to June 2023 was 104.3% higher than in the first half of 2019, the year before the pandemic and protests over police violence.
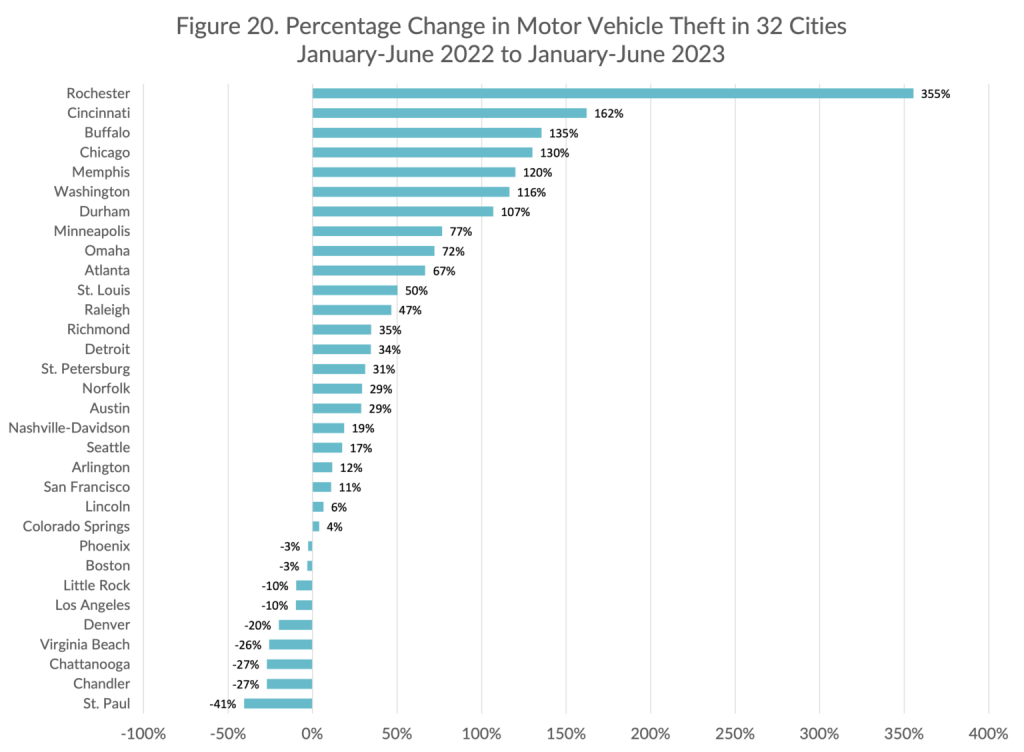
The continuing increase in motor vehicle theft is particularly striking. While not all cities reporting data for this study experienced a rise in motor vehicle thefts, seven saw an increase of 100% or more during the first six months of 2023 compared to the same period in 2022 (see Figure 20). Rochester, NY, had the largest increase, with a rise in vehicle thefts of more than 300%. St. Paul experienced a 41% drop in motor vehicle thefts during the timeframe, the largest decrease in the sample.
KEY TAKEAWAY
The number of motor vehicle thefts was 33.5%—23,974 offenses—higher during the first half of 2023 than in the first half of 2022. Motor vehicle thefts were 104.3% higher compared to the first half of 2019, the year before the pandemic.
Drug Offenses
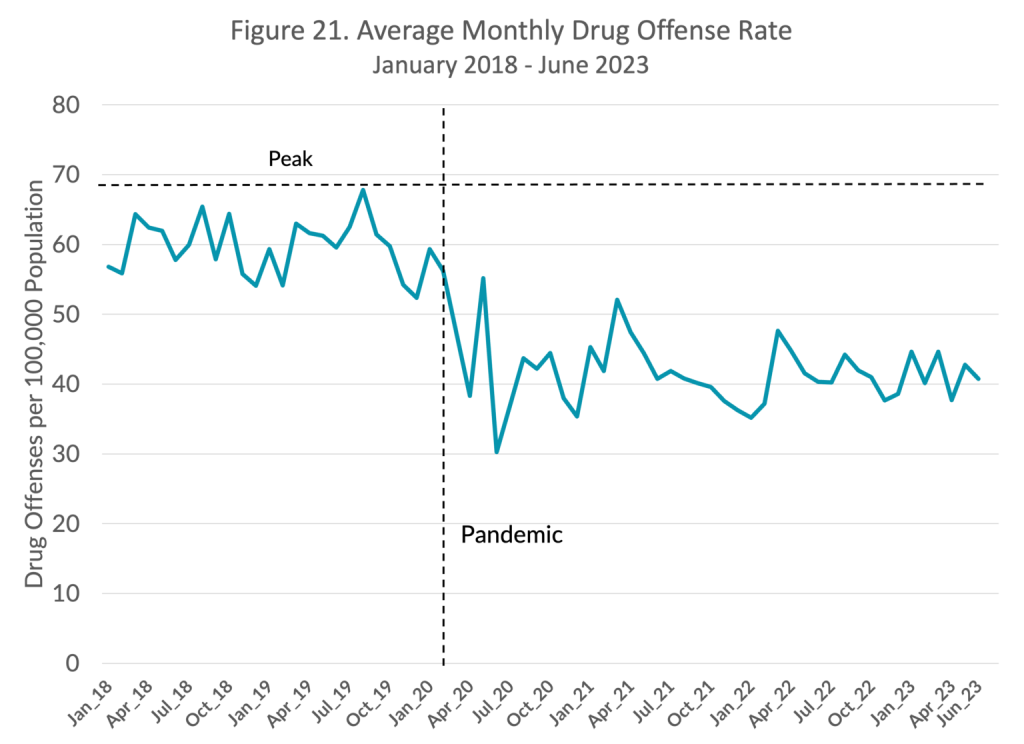
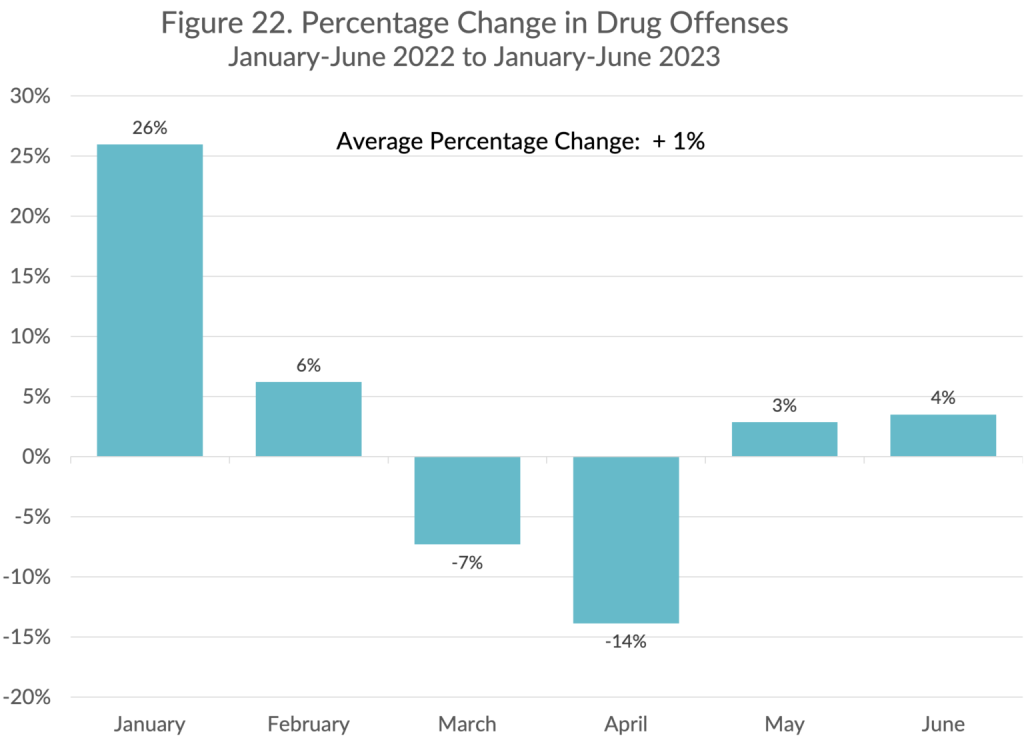
Drug offenses include arrests for the manufacture, sale, or possession of illicit drugs. The average monthly drug offense rate in the 21 cities with available data dropped during the pandemic to levels lower than at any time since the beginning of 2018 (see Figure 21). By the end of 2022, there were 0.1% fewer drug offenses than in 2021 and 38.8% fewer than in 2019. The number of drug offenses during the first half of 2023 was 1% higher, on average, than during the same period in 2022, representing 489 more drug offenses in the cities that reported data (see Figure 22). The number of drug crimes from January to June 2023 was 38.7% lower than in the first half of 2019.
KEY TAKEAWAY
The number of drug offenses was 1% higher—489 more offenses—during the first half of 2023 than in the first half of 2022. Drug offenses were 38.7% lower compared to the first half of 2019, the year before the pandemic.
Conclusion
This study is the eleventh in a series of reports for CCJ exploring crime changes since the emergence of the coronavirus pandemic and establishment of the Council’s National Commission on COVID-19 and Criminal Justice. Updating the earlier analyses, this study reveals both increases and decreases in crime rates in a sample of U.S. cities through June 2023.
The overall results suggest that some offenses in the sample cities are returning to pre-pandemic levels and others are not. Homicide is receding from its peak in 2021, but even if it were to fall back to pre-pandemic levels, the 2019 homicide rate (5.1 per 100,000 U.S. residents) was still 15% higher than the 2014 rate (4.4 per 100,000), which is the lowest level since World War II.2 While a 5.1 per 100,000 homicide rate is roughly half the modern peak of 9.8 recorded in 1991, the United States should not accept a homicide rate that claims thousands of lives each year—lives that can be saved by implementing effective violence-reduction strategies. Motor vehicle theft is another offense that exceeds pre-2020 levels. It is likely that much of this increase is the result of thefts of Kia and Hyundai models, but rates were already trending upward before these vehicles became popular targets.
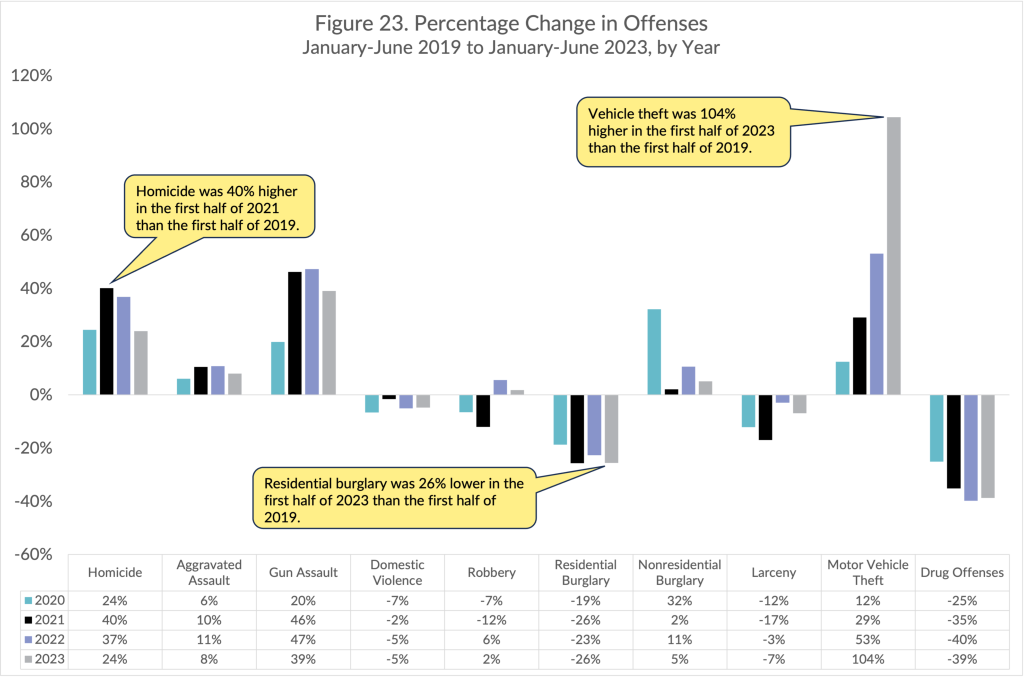
Figure 23 shows the yearly percentage change in each of the 10 crimes studied from the first half of 2019 to the first half of 2023. The figure provides a comparison of where these cities stand today compared to 2019. Most violent offenses rose in 2020 and 2021, and then began trending downward. The picture of property and drug crimes is more mixed, as many offenses remain below or around pre-2020 levels. Motor vehicle theft is a striking exception. As noted here and covered in detail in a past report, many offenses experienced large shifts during the summer of 2020. Reexamining these trends at year’s end will provide a more comprehensive picture of crime patterns after the emergence of a global pandemic and widespread social unrest., many offenses experienced large shifts during the summer of 2020. Reexamining these trends at year’s end will provide a more comprehensive picture of crime patterns after the emergence of a global pandemic and widespread social unrest.
2 LaFree, G. D. (1998). Loosing legitimacy: Street crime and the decline of social institutions in America. Westview.
The recent uptick in crimes committed to acquire money or property could reflect a return to normal living conditions and daily routines. Another factor may be the emergence of new, destabilizing economic conditions. Inflation accelerated sharply in 2021 and early 2022. But the inflation rate has fallen during the past year. The Consumer Price Index increased by just 3% in May 2023 from the year before. The reduction of enforcement actions against certain property offenses may also have contributed to the increase in property crime in some cities. However, systematic research is lacking on enforcement and specific property crimes. Additionally, it is too early to tell whether the reduction in inflation contributed to the decrease in burglaries and larcenies during the first half of this year.
Reducing homicides and gun violence should continue to be the nation’s top public safety priority. Evidence-based strategies are available to address high rates of homicide and gun violence in the short and medium term. CCJ’s Task Force on Policing and Violent Crime Working Group highlight numerous essential reforms to improve policing and strengthen the overall effectiveness of violence reduction efforts in the U.S. In addition, CCJ is currently investigating trends for multiple offenses and exploring ways to improve the nation’s crime data infrastructure through its recently formed Crime Trends Working Group.
Appendix
The cities listed below publicly reported data for the following offenses from January through June 2023.
KEY
- Homicide
- Aggravated Assault
- Gun Assault
- Domestic Violence
- Robbery
- Residential Burglary
- Nonresidential Burglary
- Larceny
- Motor Vehicle Theft
- Drug Offenses