Crime Trends in U.S. Cities
Year-End 2025 Update
January 2026
By Ernesto Lopez, Council on Criminal Justice, and
Bobby Boxerman, PhD, Regional Justice Information Service
This study updates and supplements previous U.S. crime trends reports by the Council on Criminal Justice (CCJ) with data through December 2025. It examines yearly and monthly rates of 13 violent, property, and drug offenses reported to police in 40 large American cities that have consistently reported monthly data over the past eight years. The 40 cities are not necessarily representative of all jurisdictions in the United States. Not all cities published data for each offense (see the Appendix for which cities reported which offenses), and trends in offenses with fewer reporting cities should be viewed with extra caution. Not all crimes are reported to law enforcement. In addition, the data collected for this report are subject to revision by local jurisdictions.
Key Takeaways
- Reported levels of 11 of the 13 offenses covered in this report were lower in 2025 than in 2024; nine of the offenses declined by 10% or more. Drug crimes were the only offense category that increased (+7%); sexual assault remained even.
- Looking at changes in violent offenses, the rate of reported homicides was 21% lower in 2025 than in 2024 in the 35 study cities providing data for that crime, representing 922 fewer homicides. There were 9% fewer reported aggravated assaults, 22% fewer gun assaults, and 2% fewer domestic violence incidents last year than in 2024. Robbery fell by 23% while carjackings (a type of robbery) decreased by 43%.
- When nationwide data for jurisdictions of all sizes is reported by the FBI later this year, there is a strong possibility that homicides in 2025 will drop to about 4.0 per 100,000 residents. That would be the lowest rate ever recorded in law enforcement or public health data going back to 1900, and would mark the largest single-year percentage drop in the homicide rate on record.
- Examining changes in property crimes, motor vehicle theft had been on the rise from the summer of 2020 through 2023, but that trend began to reverse in 2024 and the pattern continued in 2025. There were 27% fewer motor vehicle thefts last year than in 2024 in the study cities. Reports of residential burglaries (-17%), nonresidential burglaries (-18%), larcenies (-11%), and shoplifting (-10%) all decreased in 2025 compared to 2024.
- Assessing trends over a longer period, violent crime overall in 2025 was at or below levels in 2019, the year prior to the onset of the COVID-19 pandemic and racial justice protests of 2020. There were 25% fewer homicides in the study cities in 2025 than in 2019. Aggravated assault (-6%), gun assault (-13%), sexual assault (-4%), domestic violence (-19%), robbery (-36%), and carjacking (-29%) also were lower in 2025 than in 2019.
- Lethality (the share of serious violent crime that is fatal) declined 8% in a sample of 18 cities from 2024 to 2025. From 2019 to 2025, lethality fell 5%. Cities with the highest pre-pandemic homicide levels experienced the largest drop in lethality from 2019 to 2025 (-36%).
- Non-violent crime trends have been varied over the last seven years. There were fewer residential burglaries (-45%), larcenies (-20%), and reported shoplifting incidents (-4%) in 2025 than in 2019, but more nonresidential burglaries (+1%) and motor vehicle thefts (+9%). Drug offenses in 2025 were 19% below 2019 levels.
- The declines in crime, especially homicide, are promising, and are likely the result of a complex tangle of broad social and technological changes and direct policy interventions. Determining a cause for the decline requires a rigorous examination of the data. This report is not evidence of a policy’s success or failure; it simply documents recent crime trends from a sample of large U.S. cities.
Figure 1. Percent Change in Violent Offenses, 2019 – 2025
Figure 2. Percent Change in Non-Violent Offenses, 2019 – 2025
Table of Contents
This report updates CCJ’s previous studies of crime changes in larger American cities that began during the early months of the coronavirus pandemic, extending the analyses with data through December 2025. The 40 cities included in this study were selected based on the availability of crime numbers at the time of data collection in early January 2026 (see the Appendix for the full list). The cities range from Cary, NC, the smallest in the sample, with about 180,000 residents, to New York, the largest, with around 8.3 million residents. The mean population of the cities for which crime data were available is approximately 890,000, while the median population is roughly 540,000.
The report assesses changes between 2018 and 2025 for 13 crimes: homicide, aggravated assault, gun assault, sexual assault/rape, domestic violence, robbery, carjacking, residential burglary, nonresidential burglary, larceny, shoplifting, motor vehicle theft, and drug offenses. Trends in sexual assault are newer to this series.1 As in previous reports, special attention is given to the trend in homicides. Longer-term trends for many of these offenses are available here and overall national historical trends in crime and victimization are collected in The Footprint: Tracking the Size of America’s Criminal Justice System.
Crime data for the report were obtained from online portals of city police departments that provided monthly incident-level data for the period between January 2018 and December 2025.2 Offense counts were converted to monthly crime rates per 100,000 city residents for analysis of monthly, half-year, and annual trends. Offense classifications varied somewhat across the cities, and not all cities reported data for each crime. The number of cities reporting crime data ranged from a high of 35 for homicide to a low of nine for carjacking. Trends in offenses with fewer reporting cities should be viewed with additional caution. (See the Appendix for a list of which offenses are included for which cities.)
The crime incident data for this report were obtained within days of the end of the study period to provide a timely snapshot of crime across the nation at the end of the year.3 As a result, these figures may, and often do, differ from data subsequently published by individual police departments. The transition of national law enforcement data to the National Incident-Based Reporting System may have also affected preliminary incident data for some jurisdictions,4 and the CCJ findings may differ from other counts released later by the FBI as part of its national crime reporting program, or data reported by other nongovernmental organizations. In addition, the figures may differ from those in previous CCJ reports because they are based on a different number and mix of cities. CCJ excludes some offenses from its analysis if there is a significant difference between the incident data collected and other published numbers. As such, the data in this report should be viewed as preliminary. The city sample used for this report is not necessarily representative of every large American city or the nation as a whole. Finally, it is also important to recognize that many offenses are not reported to law enforcement, so law enforcement data understate the total volume of crime.5
Better Crime Data, Better Crime Policy
In June 2024, the Council on Criminal Justice Crime Trends Working Group released a set of findings and recommendations to improve the country’s crime data infrastructure and reporting. The group’s proposals create a roadmap for action at the federal, state, and local levels to accelerate progress toward a national crime trends monitoring system that generates the timely, accurate, complete, and usable data critical to improving crime control and prevention strategies.
Since the publication of the Working Group’s findings, the FBI has implemented two major changes to national crime data, consistent with the Group’s recommendations. First, the FBI now releases monthly crime data. Second, the FBI has expanded its crime data collection to include non-fatal shootings. In addition, the FBI has emphasized that the reported crime statistics reflect only incidents reported to law enforcement, an important clarification that acknowledges the gap between crime occurrence and crime reporting and moves the field toward a more complete understanding of crime trends.
Other pending proposals from the Working Group include sufficiently funding the federal Bureau of Justice Statistics; joint publication by federal agencies of a comprehensive annual compendium of crime in the U.S. that simultaneously reports law enforcement and victimization survey data and includes cybercrime, hate crime, securities fraud, and other important types of crime; and establishment of a National Justice Data Analysis Center that would define national best practices for law enforcement agencies to visualize and share data, provide training and technical assistance to help agencies deploy data to improve crime analysis and prevention, and enhance crime trends data science.
Changes in Violent Offenses
Homicide
Homicide is the unlawful killing of one person by another and is classified as murder or non-negligent manslaughter. Figure 3 displays the average yearly and six-month homicide rates in the 35 cities for which homicide incident data were available at year-end 2025 (see Appendix).
- Change 2024-2025: The average reported homicide rate last year was 21% lower than in 2024, representing 922 fewer homicides in the cities that reported data.
- Change 2019-2025: Across the sample cities, the 2025 average homicide rate was about 25% lower than in 2019.
- Change from peak: Over the past eight years, the highest average homicide rate was in 2021—18.6 per 100,000. The 2025 rate (10.4) was 44% below that peak.
Comparing the most recent six-month trends, the homicide rate during the first half of 2025 was 18% lower, on average, than during the same period in 2024, and 24% lower during the second half of the year.
Figure 3. Homicide Rates in 35 Cities, 2018–2025
Figure 4 shows the percentage change in homicide, by city, from 2024 to 2025 and from 2019 to 2025.
- Change 2024-2025: Homicides fell in 31 of the 35 cities from 2024 to 2025. Denver, CO, Washington, DC, and Omaha, NE, saw the largest decreases, with drops of 41%, 40%, and 40%, respectively. Little Rock, AR, experienced the largest increase (16%).
- Change 2019-2025: Twenty-seven of the 35 cities had lower homicide rates in 2025 than in 2019, with Baltimore, MD, experiencing the largest drop (60%). Of those cities with 2025 homicide rates above 2019 levels, Milwaukee, WI, had the largest percentage increase (42%).
Figure 4. Percent Change in Homicide in 35 Cities, 2019–2025
Different Sources, Different Numbers
To ensure accuracy, CCJ performs additional checks on the homicide data it collects directly from law enforcement and municipal data portals. Table A2 shows the differences in counts between CCJ’s yearly totals for 2025 and other published sources, typically the reporting law enforcement agency or local media. As the table shows, the homicide rates in Richmond, VA, and Los Angeles, CA, were notably different in both count and percentage. Some differences may occur due to updating, a lack of updating, or slight variations in offense definitions. For the most up-to-date information on a specific city, please visit its website.
Nearly all cities in the study sample experienced a homicide decline from 2024 to 2025, and the majority saw numbers fall below 2019 levels. However, the size and timing of the declines differed across all cities.
Figure 5 shows the percentage change in homicide by year for cities with high, medium, and low homicide levels. On average, cities with high homicide levels experienced the smallest increase from 2019 to 2020 and saw declines begin in 2022, compared with cities with medium or low homicide levels. Though homicide levels remained elevated in 2023 compared with 2019, cities of all three sizes were experiencing declines by 2025. By 2024, the homicide rate in the highest-homicide cities was 17% lower than in 2019, and it was 36% lower by 2025; this marked the largest decline across all groups. It should also be noted that small changes in homicides for lower-homicide jurisdictions can result in large percentage changes.
Figure 5. Percent Change in Homicide Rates by City Homicide Levels, 2019–2025
Lethality
Figure 6 shows average lethality and homicide trends for a sample of 18 large U.S. cities, along with lethality trends for each city. Lethality is the number of homicides per 1,000 aggravated assaults and robberies. Only cities with homicide, aggravated assault, and robbery that are included in this report are represented in the lethality analysis. An increase in lethality means that homicides made up a larger share of violent incidents, even if the overall homicide rate was stable. If assaults and robberies drop while homicides remain flat, for example, then lethality will rise. The average lethality level in 2025 was 8% lower than in 2024. Across the sample cities, the 2025 average lethality level was about 5% lower than in 2019. Over the past eight years, the highest lethality level—27.5—was in 2022. The 2025 level (18.9) was 31% below that peak.
Across the sample of 18 cities with complete homicide, aggravated assault, and robbery data, the average reported homicide rate in 2025 was 20% lower than in 2024. (Note: This is different than the number in the homicide section above because the sample is different.) Across the 18 sample cities, the 2025 average homicide rate was about 31% lower than in 2019. When lethality peaked in 2022, the average reported homicide rate was 22.9 (per 100,000). The 2025 rate (12.8) was 44% below that peak. The decline in lethality shows that homicides declined at a greater rate than aggravated assaults and robberies.
Figure 6. Lethality Trends for 18 Cities, 2018–2025
Multiple developments could explain the rapid rise and subsequent fall of homicide rates over the past several years, but identifying decisive factors with certainty is challenging. Much of the research published on crime during this period has described trends but has not directly measured or tested possible contributing factors. Nevertheless, researchers and practitioners have pointed to a range of possible influences, including changes in criminal justice policy and practice, shifts in people’s routine activities and social behavior, economic conditions, technology use, and local violence prevention efforts. For more information, please see these perspectives from experts in the field.
Aggravated Assault
Aggravated assaults are assaults committed with a deadly weapon or those that result in or threaten serious bodily injury to the victim. Figure 7 displays the average yearly and six-month aggravated assault rates in the 22 cities for which data were available at year-end 2025 (see Appendix).
- Change 2024-2025: The average reported aggravated assault rate last year was 9% lower than in 2024.
- Change 2019-2025: Across the sample cities, the 2025 average aggravated assault rate was about 6% lower than in 2019.
- Change from peak: Over the past eight years, the highest average aggravated assault rate was in 2021—587.7 (per 100,000). The 2025 rate (475.2) was 19% below that peak.
Comparing the most recent six-month trends, the aggravated assault rate during the first half of 2025 was 7% lower, on average, than during the same period in 2024, and 11% lower during the second half of the year.
For a more detailed look at trends in aggravated assault and other assaults, please see CCJ’s fact sheet on the offense.
Figure 7. Aggravated Assault Rates in 22 Cities, 2018–2025
Gun Assault
Gun assaults are aggravated assaults committed with a firearm. Figure 8 displays the average yearly and six-month gun assault rates in the 11 cities for which data were available at year-end 2025 (see Appendix).
- Change 2024-2025: The average reported gun assault rate last year was 22% lower than in 2024.
- Change 2019-2025: Across the sample cities, the 2025 average gun assault rate was about 13% lower than in 2019.
- Change from peak: Over the past eight years, the highest average gun assault rate was in 2021—281.9 per 100,000. The 2025 rate (157.8) was 44% below that peak.
Comparing the most recent six-month trends, the gun assault rate during the first half of 2025 was 20% lower, on average, than during the same period in 2024, and 24% lower during the second half of the year.
For a more detailed look at trends in gun assault and other assaults, please see CCJ’s fact sheet on the offense. For more information on gun thefts, please see CCJ’s report.
Figure 8. Gun Assault Rates in 11 Cities, 2018–2025
Sexual Assault
In this report, the term sexual assault refers to aggregated counts and rates of the following offenses: forcible rape, statutory rape, and other forms of sexual assault. Cities included in the CCJ sample may have kept these individual offenses separate, combined them, or excluded one or more of the offenses from their data.
Figure 9 displays the average yearly and six-month sexual assault rates in the 22 cities for which data were available at year-end 2025 (see Appendix).
- Change 2024-2025: The average reported sexual assault rate last year was about equal to the 2024 rate.
- Change 2019-2025: Across the sample cities, the 2025 average sexual assault rate was about 4% lower than in 2019.
- Change from peak: Over the past eight years, the highest average sexual assault rate was in 2021—69.4 (per 100,000). The 2025 rate (65.5) was 6% below that peak.
Comparing the most recent six-month trends, the sexual assault rate during the first half of 2025 was 2% higher, on average, than during the same period in 2024, and 3% lower during the second half of the year.
For a more detailed look at trends in sexual assault and other assaults, please see CCJ’s fact sheet on the offenses.
Figure 9. Sexual Assault Rates in 22 Cities, 2018–2025
Domestic Violence
Domestic violence consists primarily of aggravated and so-called simple assaults committed against domestic partners or family members. Figure 10 displays the average yearly and six-month domestic assault rates in the 11 cities for which data were available at year-end 2025 (see Appendix).
- Change 2024-2025: The average reported domestic violence rate last year was 2% lower than in 2024.
- Change 2019-2025: Across the sample cities, the 2025 average domestic violence rate was about 19% lower than in 2019.
- Change from peak: Over the past eight years, the highest average domestic violence rate was in 2018—564 (per 100,000). The 2025 rate (431.5) was 23% below that peak.
Comparing the most recent six-month trends, the domestic violence rate during the first half of 2025 was 2% lower, on average, than during the same period in 2024, and 3% lower during the second half of the year.
Figure 10. Domestic Violence Rates in 11 Cities, 2018–2025
For more information on data related to this crime, please see CCJ’s report on improving aggravated domestic violence estimates at the local level. Additional details about trends in domestic and other assaults can be found in CCJ’s fact sheet on the offenses. CCJ also conducted a systematic review of domestic violence during the initial period of the pandemic and related lockdowns.
Robbery
Robberies are thefts committed with force or the threat of force. Figure 11 displays the average yearly and six-month robbery rates in the 34 cities for which data were available at year-end 2025 (see Appendix).
- Change 2024-2025: The average reported robbery rate last year was 23% lower than in 2024.
- Change 2019-2025: Across the sample cities, the 2025 average robbery rate was about 36% lower than in 2019.
- Change from peak: Over the past eight years, the highest average robbery rate was in 2018—235.7 (per 100,000). The 2025 rate (144.3) was 39% below that peak.
Comparing the most recent six-month trends, the robbery rate during the first half of 2025 was 17% lower, on average, than during the same period in 2024, and 28% lower during the second half of the year.
For a more detailed look at robbery trends, please see CCJ’s fact sheet on the offense.
Figure 11. Robbery Rates in 34 Cities, 2018–2025
Carjacking
Carjacking (a type of robbery) is theft or attempted theft of a motor vehicle by force or threat. Figure 12 displays the average yearly and six-month carjacking rates in the nine cities for which data were available at year-end 2025 (see Appendix).
- Change 2024-2025: The average reported carjacking rate last year was 43% lower than in 2024.
- Change 2019-2025: Across the sample cities, the 2025 average carjacking rate was about 29% lower than in 2019.
- Change from peak: Over the past eight years, the highest average carjacking rate was in 2023—46.7 (per 100,000). The 2025 rate (18.1) was 61% below that peak.
Comparing the most recent six-month trends, the carjacking rate during the first half of 2025 was 31% lower, on average, than during the same period in 2024, and 55% lower during the second half of the year.
For a more detailed look at carjacking trends, including offense characteristics, please see CCJ’s report on the crime.
Figure 12. Carjacking Rates in 9 Cities, 2018–2025
Changes in Non-Violent Offenses
Residential Burglary
Burglaries involve breaking and entering a residential or commercial premises for the purpose of committing a crime. Figure 13 displays the average yearly and six-month residential burglary rates in the 17 cities for which data were available at year-end 2025 (see Appendix).
- Change 2024-2025: The average reported residential burglary rate last year was 17% lower than in 2024.
- Change 2019-2025: Across the sample cities, the 2025 average residential burglary rate was about 45% lower than in 2019.
- Change from peak: Over the past eight years, the highest average residential burglary rate was in 2018—387.4 (per 100,000). The 2025 rate (188) was 51% below that peak.
Comparing the most recent six-month trends, the residential burglary rate during the first half of 2025 was 15% lower, on average, than during the same period in 2024, and 19% lower during the second half of the year.
For a more detailed look at burglary trends, please see CCJ’s fact sheet on the offense.
Figure 13. Residential Burglary Rates in 17 Cities, 2018–2025
Nonresidential Burglary
Figure 14 displays the average yearly and six-month nonresidential burglary rates in the 17 cities for which data were available at year-end 2025 (see Appendix).
- Change 2024-2025: The average reported nonresidential burglary rate last year was 18% lower than in 2024.
- Change 2019-2025: Across the sample cities, the 2025 average nonresidential burglary rate was about 1% higher than in 2019.
- Change from peak: Over the past eight years, the highest average nonresidential burglary rate was in 2020—267.6 (per 100,000). The 2025 rate (191.8) was 28% below that peak.
Comparing the most recent six-month trends, the nonresidential burglary rate during the first half of 2025 was 14% lower, on average, than during the same period in 2024, and 21% lower during the second half of the year.
For a more detailed look at burglary trends, please see CCJ’s fact sheet on the offense.
Figure 14. Nonresidential Burglary Rates in 17 Cities, 2018–2025
Larceny
Larcenies are thefts unaccompanied by force or breaking and entering. Shoplifting and thefts of property from motor vehicles are the two most common forms of larceny. Figure 15 displays the average yearly and six-month larceny rates in the 34 cities for which data were available at year-end 2025 (see Appendix).
- Change 2024-2025: The average reported larceny rate last year was 11% lower than in 2024.
- Change 2019-2025: Across the sample cities, the 2025 average larceny rate was about 20% lower than in 2019.
- Change from peak: Over the past eight years, the highest average larceny rate was in 2018—2,877.9 (per 100,000). The 2025 rate (2,297) was 20% below that peak.
Comparing the most recent six-month trends, the larceny rate during the first half of 2025 was 8% lower, on average, than during the same period in 2024, and 14% lower during the second half of the year.
For a more detailed look at larceny trends, please see CCJ’s fact sheet on the offense.
Figure 15. Larceny Rates in 34 Cities, 2018–2025
Shoplifting
Shoplifting is a theft by someone other than an employee of the victim of an item displayed for sale. Figure 16 displays the average yearly and six-month shoplifting rates in the 21 cities for which data were available at year-end 2025 (see Appendix).
- Change 2024-2025: The average reported shoplifting rate last year was 10% lower than in 2024.
- Change 2019-2025: Across the sample cities, the 2025 average shoplifting rate was about 4% lower than in 2019.
- Change from peak: Over the past eight years, the highest average shoplifting rate was in 2024—615 (per 100,000). The 2025 rate (552.2) was 10% below that peak.
Comparing the most recent six-month trends, the shoplifting rate during the first half of 2025 was 5% lower, on average, than during the same period in 2024, and 15% lower during the second half of the year. Because these data rely on incidents reported to police, and because reporting practices vary across the retail industry, they almost certainly undercount total shoplifting significantly.6
Figure 16. Shoplifting Rates in 21 Cities, 2018–2025
Shoplifting and retail theft have received widespread attention from the retail industry, policymakers, and the media in the last several years. A CCJ analysis found that the median value of stolen goods per incident increased from 2019 to 2021 and that the overwhelming majority of reported shoplifting incidents involved one or two people, rather than the large groups seen in videos of “smash-and-grab” episodes that go viral on social media.
In addition, while the number of assaults that occurred in a store increased from the first half of 2019 to the first half of 2023, the share of shoplifting incidents that involve an assault is small, accounting for about 1% of total incidents.
CCJ also took a closer look at shoplifting patterns in Chicago and Los Angeles neighborhoods. For a more detailed look at larceny and shoplifting trends, please see CCJ’s fact sheet on the offense.
Motor Vehicle Theft
Figure 17 displays the average yearly and six-month motor vehicle theft rates in the 34 cities for which data were available at year-end 2025 (see Appendix).
- Change 2024-2025: The average reported motor vehicle theft rate last year was 27% lower than in 2024.
- Change 2019-2025: Across the sample cities, the 2025 average motor vehicle theft rate was about 9% higher than in 2019.
- Change from peak: Over the past eight years, the highest average motor vehicle theft rate was in 2023—1,007.8 (per 100,000). The 2025 rate (569.8) was 43% below that peak.
Comparing the most recent six-month trends, the motor vehicle theft rate during the first half of 2025 was 25% lower, on average, than during the same period in 2024, and 29% lower during the second half of the year.
Figure 17. Motor Vehicle Theft Rates in 34 Cities, 2018–2025
Figure 18 shows the percentage change in motor vehicle theft, by city, from 2024 to 2025 and from 2019 to 2025.
- Change 2024-2025: Thirty-three of the 34 cities reporting data experienced a decrease in motor vehicle thefts from 2024 to 2025; San Francisco and Arlington, TX, experienced the largest declines (45%) from 2024 to 2025. No city experienced an increase in rates; Boston did not see a change between 2024 and 2025.
- Change 2019-2025: Twenty-one of the 34 cities had higher motor vehicle theft rates in 2025 than in 2019, with New York experiencing the largest increase (143%). Twelve cities had lower motor vehicle theft rates over this period, with Salt Lake City, UT, experiencing the largest decline (42%). The rate in St. Louis remained even. For the most up-to-date information on a specific city, please visit its website.
Figure 18. Percentage Change in Motor Vehicle Theft Rates in 34 Cities, 2019–2025
The increase in motor vehicle theft over recent years reversed a decades-long decline. Motor vehicle theft peaked in 1991 at a nationwide rate of 659 per 100,000 people. By 2019, that rate had dropped 67%, to 221 per 100,000 people—nearly identical to the rate in 1963. By 2023, however, the motor vehicle theft rate had climbed to 321, the highest rate since 2007, when it stood at 365. In addition to its direct impacts on victims, motor vehicle theft merits concern because stolen vehicles are often used to commit other crimes, including robberies, burglaries, and drive-by shootings. Please see the Council’s fact sheet on motor vehicle theft for a more detailed look.
Drug Offenses
Drug offenses include arrests for the manufacture, sale, or possession of illicit drugs. Figure 19 displays the average yearly and six-month drug offense rates in the 19 cities for which data were available at year-end 2025 (see Appendix).
- Change 2024-2025: The average reported drug offense rate last year was 7% higher than in 2024.
- Change 2019-2025: Across the sample cities, the 2025 average drug offense rate was about 19% lower than in 2019.
- Change from peak: Over the past eight years, the highest average drug offense rate was in 2018—820.3 (per 100,000). The 2025 rate (555.2) was 32% below that peak.
Comparing the most recent six-month trends, the drug offense rate during the first half of 2025 was 6% higher, on average, than during the same period in 2024, and 9% higher during the second half of the year.
Figure 19. Drug Offense Rates in 19 Cities, 2018–2025
Summary and Conclusion
This study is the 16th in a series of CCJ reports exploring crime patterns since the emergence of the coronavirus pandemic and establishment of the Council’s National Commission on COVID-19 and Criminal Justice. Updating the earlier analyses, this study reveals a decline in nearly all categories of reported crimes across a sample of U.S. cities through the full calendar year 2025.
The overall reduction in crime, especially homicide, is welcome news, especially for communities long plagued by high levels of violence. After an historic 31% increase in homicides in 2020, the largest single-year jump since 1900 (examining public health and FBI data), we are now experiencing an historic decline. In the study cities, homicide declined by 21% from 2024 to 2025 and 17% from 2023 to 2024.
Indeed, there is a strong likelihood that, once nationwide data for jurisdictions of all sizes is reported by the FBI later this year, the 2025 homicide level may be the lowest ever recorded (Figure 20). Before the FBI began crime reporting in 1930, the only available homicide data was made available through analyses of death certificates. Going back to 1900, the homicide rate has not fallen below 4.5 per 100,000, except for the FBI-reported low of 4.4 in 2014. If the FBI’s full report aligns closely with the 21% decline in this report, it would mark the largest single-year percentage drop in the homicide rate on record and bring the 2025 rate to about 4.0 per 100,000, roughly 9% below the prior historic low. (See Appendix A3 for more details on the data for Figure 20.)
Figure 20. Homicide Rate and Year-Over-Year Percent Change in Homicide, 1900–2025
A Complex Web of Potential Factors
The downward trend raises two pivotal questions for policymakers, practitioners, advocates, researchers, and other stakeholders: What’s driving the encouraging numbers and how can we maintain positive momentum? Unfortunately, identifying decisive factors, and understanding the complex interplay among them, is tricky. Without rigorous evidence, it is not possible to confidently pinpoint the factors fueling the drop in homicide. Any assertive claims about the influence of specific policy interventions, such as National Guard deployments and increased immigration enforcement or expanded community violence intervention programs, should be supported by robust research designs intended to measure their causal effects.
Widening the lens, it is also possible that broader social changes occurring over time have contributed to continued declines in homicide. With that in mind, it is useful to view the homicide trend not only as a decline from 2022 onward, but potentially as a longer drop from around 2008 to today, interrupted by brief increases between 2015 and 2017 and 2020 and 2021. One example of a broad social change during this period is that people, especially younger people, are spending more time at home (Figure 21). All crimes require opportunity. As daily routines change, so does crime.7 If individuals spend more time at home, the likelihood that they will become a crime victim decreases.8 That said, the time spent alone for 15- to 29-year-olds increased during 2020 and 2021, as did levels of homicide, indicating that additional factors are influencing homicide trends.9
Figure 21. Homicide Rate and Time Spent Alone, 2003–2023
Behavioral Shifts
Two other potentially connected behavioral shifts that have emerged over time are the overall declines in substance use, particularly alcohol, and acquisitive crime (offenses committed to obtain money or property, such as theft, burglary, or robbery). From 2000 to 2023, over 60% of adults reported occasionally drinking alcohol. However, that share declined to 58% in 2024 and to 54% in 2025.10 Research suggests alcohol consumption may lead to more aggressive behavior, and thus may increase crime.11 In a related development, the nation has seen recent steep declines in drug overdose deaths; this reverses the sharp increase in such deaths during the first two years of the pandemic, and may indicate reductions in street drug market activity.12 Such markets can be centers for concentrated violence because of unstable social dynamics, drugs’ pharmacological effects, and crime and disorder more generally.13 If illicit street drug market activity declined to pre-pandemic levels, and the associated social problems, including killings directly related to market activity, have also declined, these changes could have a meaningful impact on lowering homicide rates.
Regarding acquisitive crime, one analysis of crime trends from 1960 to 2006 found that declines in these offenses were significantly associated with declines in homicide.14 As acquisitive crime falls, so should homicide. While more research is needed to explain why acquisitive crime is falling, crimes such as robbery likely have declined in large part because of the movement toward a more cashless society. As people carry less cash in favor of digital transactions, they become less attractive targets for robbery.15 In addition, some acquisitive crimes have moved into cyberspace, where people can steal without fear of physical confrontation with their victims.
Although nearly all offenses covered in this report have declined, that does not necessarily mean that all crime types have declined. While some crimes, such as robbery and residential burglary, have been falling for decades, it is likely that other offenses, such as fraud and identity theft, have increased as more people engage in e-commerce and other online activities.16 While these offenses do not involve the direct threat of life, as is the case with a robbery or burglary committed when a home or business is occupied, they still cause significant harm to victims, and their full impacts are not accurately measured due to their exclusion from the nation’s primary crime reports.
More Research is the Key to Prevention
While the historic homicide drop and other crime declines recorded last year are heartening, many communities continue to suffer from distressingly high rates of violence. Moreover, it is not certain that homicide rates will drop further or remain this low. Historically, the U.S. has had homicide rates well above those of peer nations, even dating back to the early 1900s in some cases.17
Scholars should continue tackling the “why” and “what works” dimensions of this critical policy challenge, and communities should invest in evidence-backed strategies that are producing results on the ground. For families who have lost loved ones to violence, even the stunning progress of 2025 is of little comfort. Keeping that in mind will help us stay on track toward a future of even greater public safety.
Offense Dashboards
Monthly Crime Trends by Type and City, 2018 – December 2025
Percent Change in Crime from 2019 and Annual Rates, 2019–2025

Appendix
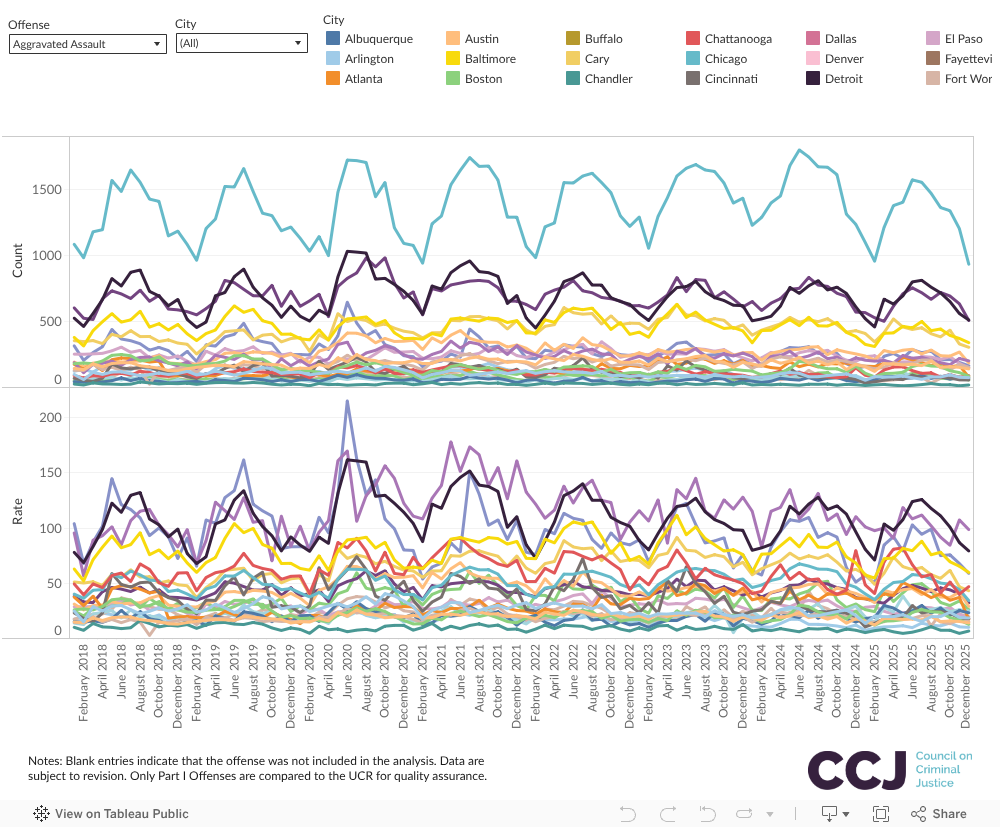
Figure A1. Monthly Crime Rates, January 2018 – December 2025
Table A1. List of Cities and Offenses Included in Report
KEY
- Homicide
- Aggravated Assault
- Gun Assaults
- Sexual Assault
- Domestic Violence
- Robbery
- Carjacking
- Residential Burglary
- Nonresidential Burglary
- Larceny
- Shoplifting
- Motor Vehicle Theft
- Drug Offenses
Table A2. Homicide Incident Comparisons for 2025
A3. Homicide Rates, 1900-2025
Figure 20 (above) presents the U.S. homicide rate from 1900 through 2025, drawing on the most authoritative data sources available for each historical period. For the early 20th century (1900–1959), homicide rates are taken from medical and vital statistics compiled by Randolph Roth, professor of History and Sociology at The Ohio State University, and reproduced in his book, American Homicide. These data rely primarily on death registration records and are widely regarded as the most reliable source for estimating homicide trends prior to the modern era of national crime reporting.
Beginning in 1960, homicide rates are drawn from the Federal Bureau of Investigation’s Crime in the United States (CIUS) series. For the period from 1960 to 1980, data were obtained from the Disaster Center, which digitized historical FBI crime rate tables that predate the FBI’s provision of downloadable datasets. These values were cross-checked against contemporaneous CIUS publications to confirm consistency.
From 1981 through 2024, homicide rates are taken directly from the FBI’s Crime in the United States reports, using the most recent releases available. When newer reports provided revised historical series, such as 10- or 20-year lookbacks included in the newest release, those updated values were used to ensure internal consistency across years.
Although the FBI began publishing national crime data in 1930, standard practice in crime trend analysis has been to anchor long-term comparisons to 1960, reflecting improvements in reporting coverage and consistency over time. A supplemental CCJ review of homicide rates reported for major U.S. cities between 1932 and 1959 indicates that the national homicide rate did not fall below 4.0 per 100,000 during this period, supporting the continuity of the combined series.
The homicide rate for 2025 is an estimate, calculated by applying a 20% decline to the 2024 national rate. This is consistent with the magnitude of year-over-year declines observed in our sample and other sources, including the FBI, the Major Cities Chiefs Association, and the Real-Time Crime Index.
About the Authors
Ernesto Lopez is a senior research specialist with the Council on Criminal Justice.
Bobby Boxerman, PhD, is a research analyst with the Regional Justice Information Service. His research interests include criminal justice and public safety policy, police education and training, violent crime reduction, and firearm violence.
Acknowledgements
Olivia McLarnan, along with other members of the Council on Criminal Justice team, provided support on this report.
The Council is also grateful to Richard Rosenfeld, who passed away in 2024. An eminent criminologist, Rosenfeld was the original lead author of CCJ’s crime trend reports, an inaugural CCJ member, and a mentor to the authors and many others.
This paper was produced with support from the Annie E. Casey Foundation, Arnold Ventures, the Harry Frank Guggenheim Foundation, Southern Company Foundation, and Stand Together Trust, as well the John D. and Catherine T. MacArthur Foundation and other CCJ general operating contributors.
Suggested Citation
Lopez, E., & Boxerman, B. (2026). Crime trends in U.S. cities: Year-end 2025 update. Council on Criminal Justice. https://counciloncj.org/crime-trends-in-u-s-cities-year-end-2025-update/
Endnotes
1 Sexual assault and rape were not included in some prior versions of this report. The initial sample was smaller, and many cities, compared to other Part I offenses, did not report rape. However, by expanding and combining rape with other forms of sexual assault the number of cities increased and could now be included.
2 In some cases, data was supplemented by the Real-Time Crime Index (RTCI). Incident-level homicide counts for Dallas, San Francisco, and Minneapolis did not approximate UCR counts early in the series and the RTCI was used to replace periods of clear undercounts. Data for Salt Lake City was generated using the RTCI through October, then the city’s crime dashboard for November and December 2025.
3 Efforts to compile crime data continued through January 10, 2026. Cities that had not posted full December 2025 crime data on their websites by that date could not be included in this report.
4 Examples include Seattle and Los Angeles. In Seattle, the available data do not approximate prior reporting. In Los Angeles, there appears to be a modest drop in offenses after the transition to NIBRS, but not a drastic shift.
5 By its very nature, law enforcement data misses many incidents of victimization, mostly due to victims not reporting incidents to police. Efforts to collect data on victimization from victims should continue to ensure we have a more complete picture of crime and those it harms.
6 Shoplifting data for New York City is not included in this report because the city’s incident data was not updated through the end of the year and the city’s monthly crime summaries do not include shoplifting.
7 Cohen, L. E., & Felson, M. (1979). Social change and crime rate trends: A routine activity approach. American Sociological Review, 588-608. doi.org/10.2307/2094589
8 During the onset of the COVID-19 pandemic, many researchers theorized that, as people stayed home, crime should decline until strain from the pandemic took hold, thus increasing crime. Generally, serious assaults and violence declined across most nations. Eisner, M. & Nivette, A. (2020). Violence and the pandemic: Urgent questions for research. Harry Frank Guggenehim Foundation. https://www.hfg.org/hfg_reports/violence-and-the-pandemic-urgent-questions-for-research/. Lopez, E. (2025). Violence during the COVID-19 pandemic: An international perspective. In W.C. Regoeczi & T.D. Miethe (Eds.) Research handbook on violent crime and society (pp. 479-491). Edward Elgar Publishing. https://doi.org/10.4337/9781035317868.00039
9 It is also important to recognize that while changes such as spending more time alone may reduce criminal opportunity, there may be other negative social impacts of that trend. From 2000 to 2018, suicides increased nearly every year, and by 2023, suicides were 36% higher than in 2000.
10 Saad, L. ( 2025, August, 13). U.S. drinking rate at new low as alcohol concerns surge. Gallup. https://news.gallup.com/poll/693362/drinking-rate-new-low-alcohol-concerns-surge.aspx
11 Giancola, P. R. (2000). Executive functioning: a conceptual framework for alcohol-related aggression. Experimental and Clinical Psychopharmacology, 8(4), 576. doi.org/10.1037/1064-1297.8.4.576
12 For a recent discussion of these trends see: Tuttle, J. (2025, December, 19). The 2026 Murder Forecast. https://crimeforecast.substack.com/p/the-2026-murder-forecast
13 Johnson, N. J., & Roman, C. G. (2025). Spillover effects of drug markets on gun violence across a network of neighborhoods in three Cities. Journal of Quantitative Criminology, 1-23. doi.org/10.1007/s10940-025-09621-x. Rosenfeld, R., Wallman, J., & Roth, R. (2021). The opioid epidemic and homicide in the United States. Journal of Research in Crime and Delinquency, 58(5), 545-590. doi.org/10.1177/0022427820986848
14 Rosenfeld, R. (2009). Crime is the problem: Homicide, acquisitive crime, and economic conditions. Journal of Quantitative Criminology, 25(3), 287-306. doi.org/10.1007/s10940-009-9067-9
15 Wright, R., Tekin, E., Topalli, V., McClellan, C., Dickinson, T., & Rosenfeld, R. (2017). Less cash, less crime: Evidence from the electronic benefit transfer program. The Journal of Law and Economics, 60(2), 361-383. doi.org/10.1086/693745
16 For recent data from the Federal Trade Commission see the agency’s dashboards.
17 Roth, R. (2009). American homicide. Harvard University Press.