Crime Trends in U.S. Cities
Mid-Year 2025 Update
July 2025
By Ernesto Lopez, Council on Criminal Justice, and
Bobby Boxerman, Ph.D., Regional Justice Information Service
This study updates and supplements previous U.S. crime trends reports by the Council on Criminal Justice (CCJ) with data through June 2025. It examines monthly, half-year, and yearly rates of reported crime for 13 violent, property, and drug offenses in 42 American cities that have consistently reported monthly data over the past six years.
Please note the following limitations: The 42 cities are not necessarily representative of all jurisdictions in the United States. Not all cities published data for each offense (see the Appendix for which cities reported which offenses), and trends in offenses with fewer reporting cities should be viewed with extra caution. In addition, not all crimes are reported to law enforcement, and the data collected for this report are subject to revision by local jurisdictions.
Key Takeaways
- Reported levels of 11 of the 13 offenses covered in this report were lower in the first half of 2025 than in the first half of 2024; domestic violence was the only offense that rose during this period, and drug offenses remained even.
- Looking at changes in violent offenses from the first six months of 2024 and 2025, the rate of homicides in the 30 study cities providing data for that crime was 17% lower, representing 327 fewer homicides. There were 10% fewer reported aggravated assaults, 21% fewer gun assaults, 10% fewer sexual assaults, and 3% more domestic violence incidents. Robbery fell by 20%, while carjackings (a type of robbery) decreased by 24%.
- Motor vehicle theft had been on the rise from the summer of 2020 through 2023, but that trend reversed in 2024 and the downward trajectory continued into this year; there were 25% fewer motor vehicle thefts in the first half of 2025 than in the first half of 2024.
- Reports of residential burglaries (-19%), non-residential burglaries (-18%), larcenies (-12%), and shoplifting (-12%) all fell in the first six months of 2025 compared to the first part of 2024, while drug offenses remained even.
- Examining trends over a longer timeframe, violent crimes are below levels seen in the first half of 2019, the year prior to the onset of the COVID pandemic and racial justice protests of 2020. There were 14% fewer homicides in the study cities in the first half of 2025 than in the first half of 2019. Similarly, reported aggravated assault (-5%), gun assaults (-4%), sexual assault (-28%), domestic violence (-8%), robbery (-30%), and carjacking (-3%) were lower in 2025.
- As noted in prior CCJ reports, much of the decline in the national homicide rate that began in late 2022 was driven by large declines in a few sample cities with high homicide levels. The most recent data show that all of the sample cities are now below the general peak of 2020 to 2021, but only 38% of the city sample is below pre-2020 levels, when comparing across 12-month periods.
- Property crime trends have been mixed over the last six years. There were fewer reported residential burglaries (-47%), larcenies (-19%), and shoplifting incidents (-4%) in the first half of 2025 than in the first half of 2019. Of the 13 offenses covered in this analysis, only one—reported motor vehicle theft—remained elevated (+25%) compared to mid-year 2019 totals, while nonresidential burglaries were even with those levels. Drug offenses in the first half of 2025 were 27% below levels seen in the first half of 2019.
- Though these declines are promising, especially the drop in homicide rates, crime trends can be deceptive. After reaching an historic low in 2014, the national homicide rate spiked by 23% just two years later. While there are plausible theories for that turnabout, and for the volatile patterns over the past five years, the drivers of these trends are poorly understood. Greater investment in rigorous research is critical to shed more light on the changing crime landscape and to craft effective crime control approaches for the future. In the meantime, many communities continue to suffer from disturbingly high rates of violence, and evidence-based crime reduction strategies are still urgently needed.
Figure 1. Percent Change in Violent Offenses, January to June 2019 – 2025
Figure 2. Percent Change in Property Offenses, January to June 2019 – 2025
Introduction
This report updates CCJ’s previous studies of crime changes in larger American cities. The series began during the early months of the coronavirus pandemic in 2020, and this report extends the analyses with data through June 2025. The 42 cities included in this study were selected based on the availability of data at the time of data collection in early July 2025 (see the Appendix for the full list). They range from Cary, NC, the smallest, with about 182,000 residents, to New York, the largest, with around 8.3 million residents. The mean population of the cities for which crime data were available is approximately 822,000, while the median population is roughly 510,000.
The report assesses changes between 2018 and 2025 for 13 crimes: homicide, aggravated assault, gun assault, sexual assault/rape, domestic violence, robbery, carjacking, residential burglary, nonresidential burglary, larceny, shoplifting, motor vehicle theft, and drug offenses. Trends in sexual assault are a recent addition to this series.1 As in previous reports, special attention is given to the trend in homicides. Long-term trends for many of these offenses are available here.
Crime data for this report were obtained from online portals of city police departments that provided monthly incident-level data for the period between January 2018 and June 2025. Offense counts were converted to monthly crime rates per 100,000 city residents for analysis of monthly, half-year, and yearly trends. Offense classifications varied somewhat across the cities, and not all cities reported data for each crime. The number of cities reporting crime data ranged from a high of 36 for larceny and motor vehicle theft to a low of nine for carjacking and domestic violence. Trends in offenses with fewer reporting cities should be viewed with additional caution. (See the Appendix for a list of which offenses are included for which cities.)
The crime incident data for this report were obtained within days of the end of the study period to provide a timely snapshot of crime across the nation at the midpoint of the year.2 As a result, these figures may—and often do—differ from data subsequently published by individual police departments. The findings also may differ from counts released much later by the FBI as part of its national crime reporting program, or findings published in reports by other nongovernmental organizations. In addition, the figures may differ from those in previous CCJ reports because they are based on a different number and mix of cities. Finally, CCJ excludes some offenses from its analysis if there is a significant difference between the incident data collected and other published numbers. As such, the data in this report should be viewed as preliminary. The city sample used for this report is not necessarily representative of every large American city or the nation as a whole. It is also important to recognize that many offenses are not reported to law enforcement.
Better Crime Data, Better Crime Policy
Timely, accurate, complete, and usable crime trends data are critical to guiding efforts to control and prevent crime in the U.S. But despite recent improvements, national crime data still fall short of what are needed to sufficiently inform policy, practice, and political dialogue. At stake are billions in government spending on public safety and criminal justice, the viability of businesses and urban centers, and the extent to which Americans are safe, and feel safe, in their homes and communities.
In June 2024, the Council on Criminal Justice Crime Trends Working Group released a set of findings and recommendations to improve the country’s crime data infrastructure and reporting. The group’s proposals create a roadmap for action at the federal, state, and local levels to accelerate progress toward a national crime trends monitoring system that generates the timely, accurate, complete, and usable data critical to improving crime control and prevention strategies.
Changes in Violent Offenses
Homicide
Homicide is the unlawful killing of one person by another. Figure 3 displays the average homicide rate by half-year in the 30 cities for which incident data on the crime were available through June 2025 (see Appendix for the city list). The homicide rate during the first half of 2025 was 17% lower, on average, than during the same period in 2024, representing 327 fewer homicides in the cities that reported data. February (-23%) and June (-24%) saw the largest decreases compared to the same months in 2024 (Figure 4). Across the sample cities, the homicide rate in the first half of 2025 was about 14% lower than during the first half of 2019. This decrease follows a sizable increase in homicide from the first half of 2019 to the first half of 2020 (+19%), then another increase of 14% between the first half of 2020 to the first half of 2021. Monthly rates are displayed in the Appendix (Figure A1).
Figure 3. Homicide Rates in 30 Cities, January 2018 – June 2025
Figure 4. Monthly Homicide Rates in 30 Cities, 2024 – June 2025
Figure 5 shows the percentage change in homicide, by city, from the first half of 2024 to the first half of 2025 and from the first half of 2019 to the first half of 2025. Not all cities followed the sample-wide trend. Five of the 29 cities experienced homicide increases from 2024 to 2025, with Little Rock, AR, and Virginia Beach, VA, experiencing the largest increases—39% and 28%, respectively. Of the cities that saw homicide fall over this period, Denver had a 45% decrease and Chattanooga experienced a 41% drop, the two largest decreases in the sample. For the most up-to-date information on a specific city, please visit its website.
As in past reports, the analysis found more variation in the longer-term trends, with 10 cities experiencing higher homicide rates in the first half of 2025 than in the first part of 2019. Over this period, Colorado Springs experienced the largest percentage increase (94%) while Baltimore had the largest decrease (-56%). It’s important to note that cities with lower homicide rates can experience large percentage changes in their rate with even a small change in the number of homicides.
Figure 5. Percent Change in Homicide in 29 cities, January to June, 2019-25, 2024-25
Comparing 12-Month Rates Using July to June as a Full Year
Much of the analysis in this report focuses on how crime has changed during the first six months of 2025 compared to a previous six-month period. While this approach makes comparisons simple to produce and understand, it is limited because it omits the second half of the year. An alternative approach is to look at a 12-month period and compare it to another 12-month period.
Figure 6 shows percentage changes over 12-month periods to examine how homicide levels shifted during the homicide peak of 2020 to 2021, with the most recent data ending in June 2025. Each tab in Figure 6 shows the percent change in homicide from the 12-month period of July 2018 to June 2019 and compares it to another 12-month period. (For example, the tab marked “Tab 2022-2023” compares the homicide rates between July 2022 and June 2023 to the homicide rates between July 2018 and June 2019.)
Shifting across the different tabs shows the evolution of homicide in the sample cities from before 2020 to June 2025.
Figure 6 shows the remarkable uniformity of a homicide increase followed by a varied decline. Only two of the 29 cities shown (Cary, NC, is excluded) experienced lower homicide rates between the summers of 2020 and 2021. Virginia Beach shows a 51% decline due to a mass shooting in May 2019 that killed 12 people, thus increasing the 2019 homicide rate well above typical levels. Between the summers of 2021 and 2022, a few cities began to show declines and fall below the 2018 to 2019 levels. However, for many cities, after the large increase in 2020, homicide remained elevated but fairly flat through 2023. The average percentage changes from pre-pandemic were 49% (from July 2018-June 2019 to July 2020-June 2021), 51% (to the same period 2021-2022), and 42% (to 2022-2023). In contrast, the 2023 to 2024 period was 17% above the 2018-2019 level and the 2024 to 2025 period fell to 1% below.
As noted in prior reports, much of the homicide decline in recent years has been driven by cities with historically high homicide levels. This pattern begins to emerge during the 2023 to 2024 period with large decreases in Baltimore and St. Louis. Still, during this timeframe, only nine of the 29 cities experienced homicide rates lower than the 2018 to 2019 period. Examining the summer of 2024 to 2025 period, it is during this timeframe that homicide rates in the cities fall below the peak rates of 2020 and 2021; only 11 cities (38% of the sample), however, had homicide rates below the 2018 to 2019 levels. Taken together, the trends suggest that homicide rates in all the sample cities have dropped below the recent peaks of 2020 and 2021, but the majority of cities still have rates higher than pre-2020 levels.
Figure 6. 12-Month Percent Changes in Homicide, July 2018 to June 2019 Compared to More Recent 12-Month Periods
Multiple developments could explain the rise and subsequent fall of homicide rates, but identifying decisive factors with certainty is challenging. The principal reason is that much of the research published on crime during this period has described trends but has not directly measured or tested possible contributing factors. Nevertheless, crime scholars theorize that pandemic-related changes in people’s daily activities and emotional and economic stress levels, changes in police practices, a rupture of public trust in law enforcement, and the suspension or reduction of social supports and programs likely influenced the trends. For more information, please see this summary of possible explanations from members of the CCJ Crime Trends Working Group.
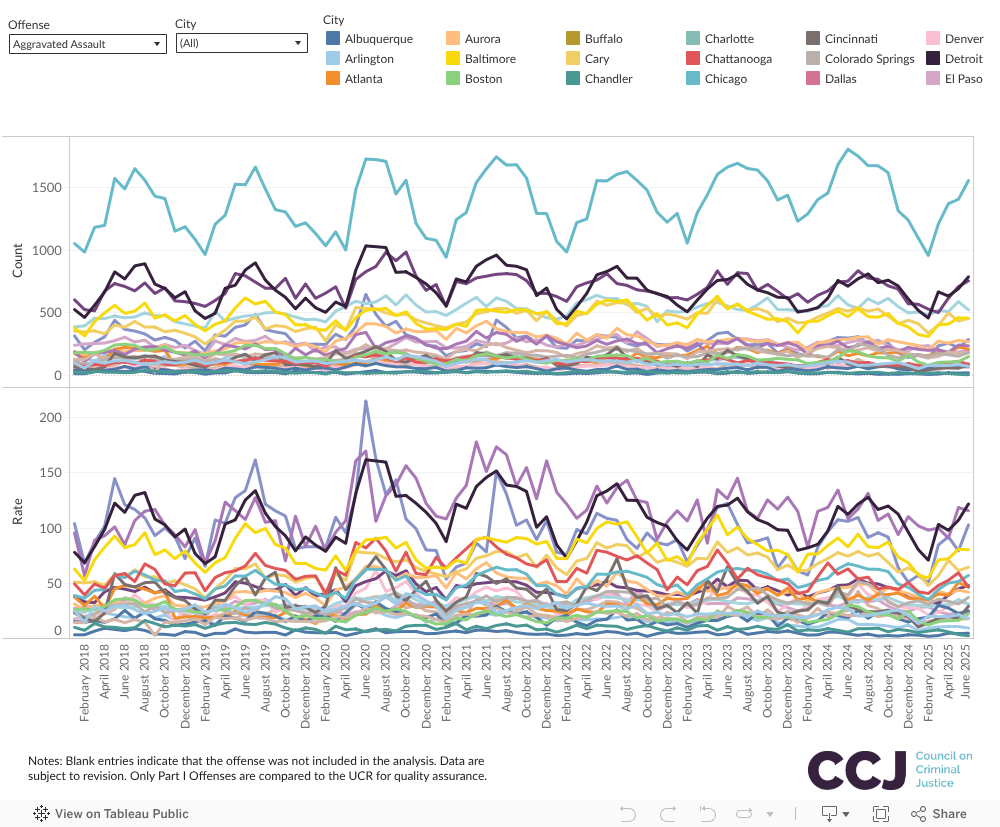
Aggravated Assault
Aggravated assaults are assaults committed with a deadly weapon or those that result in or threaten serious bodily injury to the victim. Figure 7 displays the average aggravated assault rate by half-year in the 23 cities for which incident data on the crime were available through June 2025 (see Appendix). The reported rate of aggravated assault during the first half of 2025 was 10% lower, on average, than during the same period in 2024. May (-16%), followed by February (-11%) and April (-11%), saw the largest decreases compared to the same months in 2024 (Figure 8). The reported aggravated assault rate in the first half of 2025 was about 5% lower than during the first six months of 2019. Monthly rates are displayed in the Appendix (Figure A1).
For a more detailed look at trends in aggravated assault and other assaults, please see CCJ’s fact sheet.
Figure 7. Aggravated Assault Rates in 23 Cities, January 2018 – June 2025
Figure 8. Monthly Aggravated Assault Rates in 23 cities, 2024 – June 2025
Gun Assault
Gun assaults are aggravated assaults committed with a firearm. Figure 9 displays the average gun assault rate by half-year in the 11 cities for which gun assault incident data were available through June 2025 (see Appendix). The reported rate of gun assault during the first half of 2025 was 21% lower, on average, than during the same period in 2024. April (-27%) and May (-24%) saw the largest decreases compared to the same months in 2024 (Figure 10). The reported gun assault rate in the first half of 2025 was 4% lower than during the first half of 2019. Monthly rates are displayed in the Appendix (Figure A1).
For a more detailed look at trends in aggravated assault and other assaults, please see CCJ’s fact sheet.
Figure 9. Gun Assault Rates in 11 Cities, January 2018 – June 2025
Figure 10. Monthly Gun Assault Rates in 11 Cities, 2024 – June 2025
Sexual Assault
In this report, the term sexual assault refers to aggregated counts and rates of the following offenses: forcible rape, statutory rape, and other forms of sexual assault. While most crimes are tracked in similar ways across cities, that is not always the case for sexual offenses. For example, cities included in the CCJ sample may have kept rape and other individual sex offenses separate, combined them, or excluded all three offenses from their data. Figure 11 displays the average sexual assault rate by half-year in the 23 cities for which data were available through June 2025 (see Appendix). The reported rate of sexual assault during the first half of 2025 was 10% lower, on average, than during the same period in 2024. January and May (both -16%) saw the largest decreases compared to the same months in 2024 (Figure 12). Overall, the reported sexual assault rate in the first half of 2025 was 28% lower than during the first half of 2019. Monthly rates are displayed in the Appendix (Figure A1).
For a more detailed look at trends in sexual assault and other assaults, please see CCJ’s fact sheet.
Figure 11. Sexual Assault Rates in 23 Cities, January 2018 – June 2025
Figure 12. Monthly Sexual Assault Rates in 23 Cities, 2024 – June 2025
Domestic Violence
Domestic violence consists primarily of aggravated and less severe, or so-called “simple” assaults, committed against domestic partners or family members. Figure 13 displays the average domestic violence rate by half-year in the nine cities for which data on the crime were available through June 2025 (see Appendix). The reported rate of domestic violence during the first half of 2025 was 3% higher, on average, than during the same period in 2024. February (15%) and March (6%) saw the largest increases compared to the same months in 2024 (Figure 14). Overall, the reported domestic violence rate in the first half of 2025 was 8% lower than during the first half of 2019. Monthly rates are displayed in the Appendix (Figure A1).
Figure 13. Domestic Violence Rates in Nine Cities, January 2018 – June 2025
Figure 14. Monthly Domestic Violence Rates in Nine Cities, 2024 – June 2025
Please see CCJ’s report on improving aggravated domestic violence estimates at the local level. For a more detailed look at trends in domestic and other assaults, please see CCJ’s fact sheet. Additional information can be found in CCJ’s systematic review of domestic violence during the initial period of the pandemic and related lockdowns.
Robbery
Robberies are thefts committed with force or the threat of force. Figure 15 displays the robbery rate by half-year in the 36 cities for which robbery incident data were available through June 2025 (see Appendix). The reported rate of robbery during the first half of 2025 was 20% lower, on average, than during the same period in 2024. February (-24%) and June (-23%) saw the largest decreases compared to the same months in 2024 (Figure 16). The reported robbery rate in the first half of 2025 was 30% lower than during the first half of 2019. Monthly rates are displayed in the Appendix (Figure A1).
For a more detailed look at robbery trends, please see CCJ’s fact sheet on the offense.
Figure 15. Robbery Rates in 36 Cities, January 2018 – June 2025
Figure 16. Monthly Robbery Rates in 36 Cities, 2024 – June 2025
Carjacking
Carjacking is the theft or attempted theft of a motor vehicle by force or threat. Figure 17 displays the carjacking rate by half-year in the nine cities for which incident data on the offense were available through June 2025 (see Appendix). The reported rate of carjacking during the first half of 2025 was 24% lower, on average, than during the same period in 2024. March (-54%) and February (-29%) saw the largest decreases compared to the same months in 2024 (Figure 18). The reported carjacking rate in the first half of 2025 was 3% lower than the first half of 2019. Monthly rates are displayed in the Appendix (Figure A1).
For a more detailed look at carjacking trends, including offense characteristics, please see CCJ’s report on carjacking.
Figure 17. Carjacking Rates in 9 Cities, January 2018 – June 2025
Figure 18. Monthly Carjacking Rates in 9 Cities, 2024 – June 2025
Changes in Property and Drug Offenses
Residential Burglary
Burglaries involve breaking into and entering a residential or commercial premise for the purpose of committing a crime. Figure 19 displays the residential burglary rate by half-year in the 18 cities for which residential burglary incident data were available through June 2025 (see Appendix). The reported rate of residential burglary during the first half of 2025 was 19% lower, on average, than during the same period in 2024. February (-26%) and June (-21%) saw the largest decreases compared to the same months in 2024 (Figure 20). The reported residential burglary rate in the first half of 2025 was 47% lower in than the first half of 2019. Monthly rates are displayed in the Appendix (Figure A1).
For a more detailed look at burglary trends, please see CCJ’s fact sheet on the offense.
Figure 19. Residential Burglary Rates in 18 Cities, January 2018 – June 2025
Figure 20. Monthly Residential Burglary Rates in 18 Cities, 2024 – June 2025
Nonresidential Burglary
Figure 21 displays the nonresidential burglary rate by half-year in the 18 cities for which incident data on the crime were available through June 2025 (see Appendix). The reported rate of nonresidential burglary during the first half of 2025 was 18% lower, on average, than during the same period in 2024. March (-25%) and June (-23%) saw the largest decreases compared to the same months in 2024 (Figure 22). The reported nonresidential burglary rate in the first half of 2025 was identical to the first half of 2019. Monthly rates are displayed in the Appendix (Figure A1).
For a more detailed look at burglary trends, please see CCJ’s fact sheet on the offense.
Figure 21. Nonresidential Burglary Rates in 18 Cities, January 2018 – June 2025
Figure 22. Nonresidential Burglary Rates in 18 Cities, 2024 – June 2025
Larceny
Larcenies are thefts unaccompanied by force or breaking and entering. Figure 23 displays the larceny rate by half-year in the 36 cities for which incident data on the crime were available through June 2025 (see Appendix). The reported rate of larceny during the first half of 2025 was 12% lower, on average, than during the same period in 2024. February and June (-17%), saw the largest decreases compared to the same months in 2024 (Figure 24). The reported larceny rate in the first half of 2025 was 19% lower than in the first half of 2019. Monthly rates are displayed in the Appendix (Figure A1).
For a more detailed look at larceny trends, please see CCJ’s fact sheet on the offense.
Figure 23. Larceny Rates in 36 Cities, January 2018 – June 2025
Figure 24. Monthly Larceny Rates in 36 Cities, 2024 – June 2025
Shoplifting
Shoplifting is a theft by someone other than an employee of the victim of an item displayed for sale. Figure 25 displays the shoplifting rate by half-year in the 22 cities for which shoplifting incident data were available through June 2025 (see Appendix). The reported rate of shoplifting during the first half of 2025 was 12% lower, on average, than during the same period in 2024. June (-26%) and February (-15%) saw the largest shoplifting decreases relative to the same months in 2024 (Figure 26). The reported shoplifting rate in the first half of 2025 was 4% lower than in the first half of 2019. Because these data rely on incidents reported to police, and because reporting practices vary across the retail industry, they almost certainly undercount total shoplifting by a significant amount.3 Monthly rates are displayed in the Appendix (Figure A1).
Figure 25. Shoplifting Rates in 22 Cities, January 2018 – June 2025
Figure 26. Monthly Shoplifting Rates in 22 Cities, 2024 – June 2025
Shoplifting and retail theft have received widespread attention from the retail industry, policymakers, and the media over the last three years. A CCJ analysis found that the median value of stolen goods per incident increased from 2019 to 2021 and that the overwhelming majority of reported shoplifting incidents involved one or two people, rather than the large groups seen in videos of “smash-and-grab” episodes that go viral on social media.
The analysis also found that the number of assaults that occurred in a store increased from the first half of 2019 to the first half of 2023, but the share of shoplifting incidents that involve an assault is small, accounting for about 1% of total incidents.
In a separate study, CCJ took a close look at shoplifting patterns in Chicago and Los Angeles neighborhoods. For more details on larceny and shoplifting trends, please see CCJ’s fact sheet on the offense.
Motor Vehicle Theft
Figure 27 displays the motor vehicle theft rate by half-year in the 36 cities for which incident data on the crime were available through June 2025 (see Appendix). The reported rate of motor vehicle theft during the first half of 2025 was 25% lower, on average, than during the same period in 2024. February (-30%) and June (-28%) saw the largest decreases compared to the same months in 2024 (Figure 28). The reported motor vehicle theft rate in the first half of 2025 was 25% higher than the first half of 2019. Monthly rates are displayed in the Appendix (Figure A1).
Figure 27. Vehicle Theft Rates in 36 Cities, January 2018 – June 2025
Figure 28. Monthly Vehicle Theft Rates in 36 Cities, 2024 – June 2025
Figure 29 shows the percentage change in motor vehicle theft, by city, from the first half of 2024 to the first half of 2025, and from the first half of 2019 to the first half of 2025. During the first half of 2025, only one city (El Paso, TX) experienced an increase compared to the same period in 2024. Looking back further, while nearly all of the cities in the sample have seen recent declines, 21 of them (58%) had higher motor vehicle theft rates in the first half of 2025 compared to the first half of 2019. In seven of the sample cities, motor vehicle theft was at least twice as high (an increase of more than 100%) in the first half of 2025 compared to the first half of 2019.
Figure 29. Percentage Change in Motor Vehicle Theft in 36 cities, January to June 2024 – 2025 and January to June 2019 – 2025
The increase in motor vehicle theft over recent years reversed a decades-long decline. The reported rate of motor vehicle theft peaked in 1991 at 659 per 100,000 people. By 2019, that rate had dropped by 67% to 221 per 100,000 people, nearly identical to the rate in 1963. By 2023, however, the most recent year for which full national data are available, the motor vehicle theft rate had climbed to 319, the highest seen since 2007 (368 per 100,000).
In addition to its direct impacts on victims, motor vehicle theft merits concern because stolen vehicles are often used to commit other crimes, including robberies, burglaries, and drive-by shootings. Please see the Council’s fact sheet on motor vehicle theft for a more detailed look.
Drug Offenses
Drug offenses include arrests for the manufacture, sale, or possession of illicit drugs. Figure 30 displays the drug offense rate by half-year in the 21 cities for which data on the crime were available through June 2025 (see Appendix). The reported rate of drug offenses during the first half of 2025 remained even with the same period in 2024. Compared to the same months in 2024, the drug offense rate was 4% higher in March and 5% lower in February (Figure 31). The reported drug offense rate in the first half of 2025 was 27% lower than in the first half of 2019. Monthly rates are displayed in the Appendix (Figure A1).
Figure 30. Drug Offense Rates in 21 Cities, January 2018 – June 2025
Figure 31. Monthly Drug Offense Rates in 21 Cities, 2024 – June 2025
The trends in drug crimes exhibit a unique pattern compared to the other offenses in this report, dropping during 2020 and holding steady at similar levels through the midpoint of this year. While the data used here is limited because many drug offenses are the result of an arrest, the reasons for this stability should be further investigated by further examining arrest data and other non-police data.
Summary and Conclusion
This study is the 15th in a series of reports for CCJ exploring crime patterns since the emergence of the coronavirus pandemic and establishment of the Council’s National Commission on COVID-19 and Criminal Justice. Updating the earlier analyses, this study reveals a mix of increases and decreases in crime rates across a sample of U.S. cities through June 2025.
Overall, the findings show that most offenses in the sample cities for the first half of 2025 are below levels recorded during the first half of 2019, the year before the onset of the pandemic. Homicide, the most serious of the crimes, has fallen to 14% below the rates of the first six months of 2019. Looking at the most recent trends, 11 of the 13 offenses included in the study were at lower levels in the first half of 2025 than in the first six months of 2024. Domestic violence was the lone exception, and drug offenses remained even. Examining 12-month periods, this report’s findings generally reinforce past Council analyses showing that the large homicide declines are still concentrated in higher homicide cities (such as Baltimore and St. Louis). These findings also show that the homicide rates in all of the sample cities are below the recent peaks of 2020 and 2021, but that more than 60% of the cities continue to experience homicide levels above pre-2020 rates.
Through a related body of research, the Council recently examined the share of violent crime that becomes lethal. One analysis examined long-term lethality trends from 1994 to 2020 and found that while overall violence has decreased in the U.S., the share of violence that ends in death has increased over time. Another analysis reached similar conclusions looking at patterns in a sample of 17 large U.S. cities from 2018 to 2024. At this point, it is unclear what factors may be contributing to the national homicide decline. But the increase in lethality, coupled with the declines in non-fatal violent crime, suggests that there are fewer situations in which people are at high risk of becoming the victim of a homicide, such as during a robbery.
Understanding recent crime trends is not a purely academic exercise. From 2020 to 2024, an estimated 13,500 more people were killed by homicide than in the previous five years (2015-2019).4 Beyond the legacy of trauma and other direct consequences for victims and survivors, murder and other crimes come with immense societal costs, reminding us that even during periods of declining violence, efforts to reduce victimization must remain a priority.
This is also a time when greater research is warranted to better understand the changing crime landscape and craft effective crime control approaches for today and the future. Unlike the scholars studying crime trends before the 2000s, today’s researchers have access to significantly more—and more detailed—information on criminal incidents, along with a greater computing capacity to analyze data. For instance, the FBI’s transition from its old, more limited summary system to NIBRS data provides detailed information about crime incidents at the local level that had previously been available only for homicide. Even with these improvements, however, crime data remain incomplete. The Council’s Crime Trends Working Group identified key gaps in criminal justice data, including information on non-fatal gun violence, white-collar crime, environmental crime, and cybercrimes, and produced a set of actionable recommendations for policymakers to close those gaps. To overlook these offenses is to misrepresent the true rate of victimization in the U.S. By its very nature, law enforcement data misses many incidents of victimization, mostly due to victims not reporting incidents to police. Efforts to collect data on victimization from victims should continue to ensure we have a more complete picture of crime and those it harms.
Though encouraging, the nation’s return to lower levels of nearly all major offenses should not slow efforts to reduce crime. While homicides have dropped significantly in many of the largest American cities, many communities continue to suffer from disturbingly high rates of violence, and evidence-based crime reduction strategies, such as those prioritized by the CCJ Violent Crime Working Group, are still urgently needed. While there are many other pressing social issues that merit attention, policymakers and philanthropic organizations should use this period of declining street crime to improve our understanding and measurement of all crime so the nation is better prepared to confront trends, or crises, in the future.
Offense Dashboard
Monthly Crime Trends by Type and City, 2018 – June 2025
Appendix
Figure A1. Monthly Crime Rates, January 2018 – June 2025
KEY
- Homicide
- Aggravated Assault
- Gun Assault
- Sexual Assault
- Domestic Violence
- Robbery
- Carjacking
- Residential Burglary
- Nonresidential Burglary
- Larceny
- Shoplifting
- Motor Vehicle Theft
- Drug Offenses
Note: Only drug offenses for Fayetteville are included for 2025.
About the Authors
Ernesto Lopez is a senior research specialist with the Council on Criminal Justice.
Bobby Boxerman, Ph.D., is a research analyst with the Regional Justice Information Service. His research interests include criminal justice and public safety policy, police education and training, violent crime reduction, and firearm violence.
Acknowledgements
Olivia McLarnan, along with other members of the Council on Criminal Justice team, provided support on this report.
The Council is also grateful to Richard Rosenfeld, who passed away in 2024. An eminent criminologist, Rosenfeld was the original lead author of CCJ’s crime trend reports, an inaugural CCJ member, and a mentor to the authors and many others.
This paper was produced with support from the Annie E. Casey Foundation, Arnold Ventures, the Harry Frank Guggenheim Foundation, Southern Company Foundation, and Stand Together Trust, as well the John D. and Catherine T. MacArthur Foundation and other CCJ general operating contributors.
Suggested Citation
Lopez, E., & Boxerman, B. (2025). Crime trends in U.S. cities: Mid-year 2025 update. Council on Criminal Justice. https://counciloncj.org/crime-trends-in-u-s-cities-mid-year-2025-update/
Endnotes
1 Sexual assault and rape were not included in prior versions of this report. The initial sample was smaller, and compared to the number of cities reporting other Part I offenses, many cities did not report rape. However, when rape data were combined with data on other forms of sexual assault, the number of cities increased, allowing for inclusion of the offense.
2 Efforts to compile crime data continued through July 11, 2025. Cities that had not posted full June 2025 crime data on their websites by that date could not be included in this report.
3 According to a retail industry funded report, the number of recorded external thefts increased by 114% from 2019 to 2023, while the number of incidents reported to police generally stayed flat. See: Hibdon, J (2024). Trends in recording and reporting external theft. Retail Industry Leaders Association. https://www.rila.org/focus-areas/asset-protection/study-reveals-retail-theft-is-underreported
4 This estimate was created using homicide counts from the FBI and assumed a homicide decline of 15% between 2023 and 2024 based on the estimated decline from the Real-Time Crime Index. As of the publication of this report, FBI crime figures for 2024 are unavailable.