Crime Trends in U.S. Cities: Year-End 2023 Update
January 2024
Ernesto Lopez
Research Specialist, Council on Criminal Justice
Bobby Boxerman
Graduate Research Assistant, University of Missouri-St. Louis
DEDICATION
The Council on Criminal Justice (CCJ) dedicates this report to Dr. Richard Rosenfeld, who passed away on January 8, 2024. An eminent criminologist, Dr. Rosenfeld was the original lead author of CCJ’s crime trend reports, an inaugural CCJ member, and a mentor to both authors and many others. His contributions to the criminal justice field are inestimable and he will be deeply missed.
Note: A more up-to-date version of our crime trends report is now available. See the latest crime trends reports here.
Overview
- This study updates and supplements previous U.S. crime trends reports by the Council on Criminal Justice (CCJ) with data through December 2023. It examines monthly rates at which 12 offenses are reported to law enforcement in 38 American cities. The 38 cities are not necessarily representative of all cities in the United States. The data used to measure the crime trends are subject to revision by local jurisdictions and often differ somewhat from other published data.
- The number of homicides in the 32 study cities providing homicide data was 10% lower—representing 515 fewer homicides—in 2023 than in 2022.
- Looking at other violent offenses, there were 3% fewer reported aggravated assaults in 2023 than in 2022 and 7% fewer gun assaults in 11 reporting cities. Reported carjacking incidents fell by 5% in 10 reporting cities but robberies and domestic violence incidents each rose 2%.
- Among property crimes, reports of residential burglaries (-3%), nonresidential burglaries (-7%), and larcenies (-4%) all decreased in 2023 compared to 2022. The number of drug offenses increased by 4% over the same period.
- Motor vehicle theft, a crime that has been on the rise since the summer of 2020, continued its upward trajectory through 2023. There were 29% more reported motor vehicle thefts in 2023 than in 2022.
- Most violent offenses remained elevated in 2023 compared to 2019, the year prior to the outbreak of COVID and the widespread social unrest of 2020. There were 18% more homicides in the study cities in 2023 than in 2019, and carjacking has spiked by 93% during that period.
- Property crime trends have been more mixed. There were fewer residential burglaries and larcenies and more nonresidential burglaries in 2023 than in 2019. Motor vehicle thefts more than doubled (+105%) during this timeframe, while drug crimes fell by 27%. A dashboard of all crime rates and percent changes from 2019 to 2020, 2021, 2022, and 2023 is located at the end of this report.
- Overall, crime rates are largely returning to pre-COVID levels as the nation distances itself from the height of the pandemic, but there are notable exceptions. While decreases in homicide in the study cities (and many other cities) are promising, the progress is uneven and other sources of crime information, including household surveys of violent victimization, indicate higher rates and more pronounced shifts than reports to law enforcement agencies.
- The variance in trends now requires leaders to shift attention from broad national explanations to local factors. It is essential to identify what’s driving crime in local communities and what law enforcement and community interventions, as well as other efforts and forces, may be having impact.
- Even in cities where homicide has returned to pre-2020 levels, it is still intolerably high, with some 20,000 lives lost to intentional violence last year. Other trends, such as motor vehicle theft and carjacking, also merit significant attention. Motor vehicle theft, for instance, is considered a “keystone” crime because stolen vehicles are often used in the commission of a robbery, drive-by shooting, or other violent offense. For these reasons and to achieve long-term reductions, local, state, and federal governments, along with communities and industries, must invest in evidence-based crime prevention efforts.
Figure 1. Percent Change in Offenses, 2019–2023
This report was produced with support from the Annie E. Casey Foundation, Arnold Ventures, the Harry Frank Guggenheim Foundation, Southern Company Foundation, and Stand Together Trust, as well the John D. and Catherine T. MacArthur Foundation and other CCJ general operating contributors.
Introduction
This report updates CCJ’s previous studies of crime changes that began during the early months of the coronavirus pandemic, extending the analyses with data through December 2023. The 38 cities included in this study were selected based on the availability of data at the time of data collection (see the Appendix for full list). They range from Syracuse, NY, the smallest, with about 142,000 residents, to New York City, the largest, with more than 8.4 million residents. The mean population of the cities for which crime data were available is approximately 924,000, while the median population is roughly 533,000.
The report assesses monthly changes between 2018 and 2023 for 12 crimes: homicide, aggravated assault, gun assault, domestic violence, robbery, carjacking, residential burglary, nonresidential burglary, larceny, shoplifting, motor vehicle theft, and drug offenses. As in previous reports, special attention is given to the trend in homicides.
Crime data for the report were obtained from online portals of city police departments that provided monthly incident-level data for the period between January 2018 and December 2023. Offense counts were converted to monthly crime rates per 100,000 city residents for analysis of monthly trends. Offense classifications varied somewhat across the cities, and not all cities reported data for each crime. The number of cities reporting crime data ranged from a high of 34 for motor vehicle theft to a low of ten for carjacking. (See the Appendix for a list of which offenses are included for which cities.)
The crime incident data for this report were obtained within days of the end of the study period to provide a timely snapshot of crime across the nation1. As a result, these figures may-and often do-differ from data subsequently published by individual police departments. The findings also may differ from other counts released later by the FBI as part of its national crime reporting program. In addition, they may differ from those in previous CCJ reports because they are based on a different number and mix of cities. Finally, some offenses are excluded if there is a significant difference between the incident data collected and other published numbers. As such, the data in this report should be viewed as preliminary. Overall, the city sample used for this report is not necessarily representative of all large American cities or the nation as a whole. It is also important to recognize that many offenses are not reported to law enforcement.
Note: Rape and sexual assault are not included in this report because it relies on incident-level data, and many jurisdictions exclude these offenses in such data to protect victim identities. The most recent national figures on rape and sexual assault can be found using the Uniform Crime Report or the National Crime Victimization Survey.
1Efforts to compile crime data continued through January 12, 2024. Cities that had not posted December 2023 crime data on their websites by that date could not be included in this report.
Changes in Violent Offenses
Homicide
Homicide is the unlawful killing of one person by another. Figure 2 displays the average monthly homicide rate in the 32 cities for which homicide incident data were available at year-end 2023 (see Appendix). The analysis identified an upward cyclical pattern in the homicide rate over time. Looking at 2020, homicide dipped in February and then began an upward trend, peaking in July 2020. The homicide levels in the summer of 2020 far exceeded previous peaks during the study period, amid COVID lockdowns and widespread protests against police violence after George Floyd’s murder by Minneapolis police in May. By the end of 2020, homicide in the United States had climbed 30%, an historic single-year increase. The upward trend continued in 2021, as murders rose another 6% across the entire city sample.
The new analysis shows that across 32 study cities, the homicide rate was 18% higher in 2023 than in 2019, but fell by 10% from 2022 to 2023, representing 515 fewer homicides in those cities. Compared to the same periods in 2022, homicides decreased by 9% in the first half of 2023 and by 12% in the second half of the year.
Figure 2. Homicide Rates in 32 Cities, 2018–2023
Figure 3 shows that not all cities followed the sample-wide trend in homicide. The incident data collected for this report show that the 2022 to 2023 changes in individual cities ranged from large homicide increases in Syracuse, NY, and Washington, D.C., to substantial drops in Rochester, NY, and Arlington, TX. As noted above, crime incident data for individual cities are subject to revision. As a result, these figures may-and often do-differ from data subsequently published by individual police departments. For the most up-to-date information on a specific city, please visit its website.
Figure 3. Percentage Change in Homicides in 32 Cities, 2022–2023
Whether their numbers trended up or down in 2023, some cities are continuing to struggle with relatively high homicide rates. On average, cities with lower homicide rates seem to have remained at relatively high levels (see Figure 4). For instance, 2023 homicide rates were lower than 2019 rates in nine of the 32 study cities but they remained higher in 23 cities, by an average of 42%. Figure 4 shows changes in homicide rates among cities within three different groups of homicide rates (low, medium, or high). Each of the groups experienced a similar pattern—rising then falling over the past five years—but there were some important differences. Cities with the highest homicide rates prior to the pandemic, on average, did not experience the largest increases during 2020 or 2021. Rather, it was cities with the lowest average homicide rates in 2018-2019 that recorded the biggest increases—and are still furthest from levels seen in 2019.
Figure 4. Percent Change in Homicide Rates by City Homicide Levels, 2019-2023
Among the study cities, St. Louis and Baltimore had the highest homicide rates in 2019, followed by Detroit. St. Louis and Baltimore then experienced the largest decreases in homicide since 2019, drops of 30% and 22%, respectively. Figure 5 shows the monthly homicide trends for these three cities from 2018 to 2023. As displayed in the figure, each city experienced a different pattern. St. Louis had a single-month large increase in July 2020, pushing its homicide rate to almost double what it was in June, an increase of 26 homicides. Baltimore, by contrast, did not see a clear spike during 2020; homicide was actually down 1% that year compared to 2019, and then increased 7% from 2020 to 2021. In Detroit, homicide rose from June to November 2020, an increase that exceeded the prior two years, and spiked again in the summer of 2022. While the Baltimore pattern appears to be similar to Detroit, its homicide drop of 22% from 2019 to 2023 contrasts sharply with Detroit’s increase of 3%. Overall, the three cities with the highest homicide rates exhibited significant variation in homicide trends from 2020 to 2023.
Figure 5. Monthly Homicide Rates for St. Louis, Baltimore, and Detroit, 2018-2023
Another way to analyze the trends is to examine changes by city size (see Figure 6). It is first worth noting that larger cities do not necessarily have higher homicide rates than small cities. In 2022, for instance, New York City had a homicide rate of 4.9 per 100,000 people, while Chattanooga, TN had a rate of 14.1 per 100,000. By comparison, the national homicide rate was 6.3 per 100,000 people that year. As for changes in murder levels, cities with one million or more inhabitants experienced the largest homicide increase from 2019 to 2020, while cities with 500,000 to 1,000,000 people had the smallest increase. By 2023, cities with a population between 300,000 and 500,000 had homicide rates that were, on average, 12% higher than they were in 2019, the smallest increase of these population groups. In short, no clear pattern emerges when examining homicide trends by city size.
Figure 6. Percent Change in Homicide Rates by City Size, 2019-2023
Taken together, these findings show that while many cities experienced a rise then drop in homicides from 2019 to 2023, the timing and size of the increases and decreases varied substantially across different groups of cities. Even within states, major cities are exhibiting different trends. For instance, homicide in Chattanooga was down 12% in 2023 compared to 2019, while Memphis was up 87%. During the same comparison period, homicide in Buffalo fell 21% while rising 23% in New York City. Overall, homicide is steadily receding from its peak in 2021, an encouraging trend. Additional homicide and other offense data are located in a dashboard at the end of this report.
Multiple developments could explain the rise and subsequent fall of homicide rates, but identifying decisive factors with certainty is challenging, largely because research is incomplete and inconclusive. Pandemic-related changes in people’s daily activities and emotional and economic stress levels, changes in police practices and a rupture of public trust in law enforcement, and the suspension or reduction of social supports and programs are among the theories offered by crime scholars. Please see this summary of possible explanations from members of CCJ’s Crime Trends Working Group.
Aggravated Assault
Aggravated assaults are assaults committed with a deadly weapon or those that result in or threaten serious bodily injury to the victim. As shown in Figure 7, the average monthly aggravated assault rate in the 25 cities with available data exhibited a clear cyclical pattern over time, rising during the late spring and summer of each year and falling during the fall and winter months. Like the homicide rate, the aggravated assault rate peaked during the summer of 2020 at levels that surpassed previous highs. Across the sample of cities, the aggravated assault rate was 8% higher in 2023 than in 2019. It fell by 3% from 2022 to 2023, a decrease of 2,181 incidents in the study cities. Compared to the same periods in 2022, aggravated assault decreased by 2% in the first half of 2023 and by 3% in the second half of the year.
Figure 7. Aggravated Assault Rates in 25 Cities, 2018–2023
Gun Assault
Gun assaults are aggravated assaults committed with a firearm. As shown in Figure 8, the monthly gun assault rate in the 11 cities with available data exhibited a cyclical trend over time. Similar to the homicide and aggravated assault rates, it peaked during the summer of 2020 and declined the following year. The gun assault rate was 32% higher in 2023 compared to 2019. The rate fell by 7% from 2022 to 2023, representing 1,586 fewer incidents in the study cities. Compared to the same period in 2022, gun assaults decreased by 7% in the first half of 2023 and by 7% in the second half of the year. Data on mass shootings are not reported consistently by police agencies and, consequently, are not included in this report. However, other organizations collect such data.
Figure 8. Gun Assault Rates in 11 Cities, 2018–2023
Domestic Violence
Domestic violence consists primarily of aggravated and so-called simple assaults committed against domestic partners or family members. The monthly domestic violence rate, displayed in Figure 9, exhibited a cyclical pattern and a modest downward trend that persisted through the end of 2023. Across the sample of 13 cities, the domestic violence rate was 6% lower in 2023 compared to 2019. The domestic violence rate increased by 2% from 2022 to 2023, an increase of 784 incidents. Compared to the same period in 2022, domestic violence decreased by 2% in the first half of 2023 and by 1% in the last six months of the year. Please see CCJ’s systematic review of domestic violence for more information on patterns seen for that crime during the early phase of the pandemic and related lockdowns.
Figure 9. Domestic Violence Rates in 13 Cities, 2018–2023
Robbery
Robberies are thefts committed with force or the threat of force. The average monthly robbery rate in the 33 cities with available data was lower during the first two years of the pandemic than during the preceding two years, as shown in Figure 10. The robbery rate was 1% higher in 2023 compared to 2019. The robbery rate rose by 2% from 2022 to 2023, representing 1,206 additional incidents in the study cities. Compared to the same period in 2022, robbery decreased by 3% in the first half of 2023 and increased by 6% in the second half of the year.
Figure 10. Robbery Rates in 33 Cities, 2018–2023
Carjacking
Carjacking is theft or attempted theft of a motor vehicle by force or threat. The average monthly carjacking rate in the 10 cities with available data increased in the summer of 2020 and mostly continued to climb, with seasonal variation, through 2022 (see Figure 11). Across the sample, the carjacking rate was 93% higher in 2023 compared to 2019. The rate decreased by 5% from 2022 to 2023, representing 197 fewer incidents. Compared to the same period in 2022, carjackings declined by 11% in the first half of 2023 and increased by 2% in the second half of the year.
Figure 11. Carjacking Rates in 10 Cities, 2018–2023
Changes in Property and Drug Offenses
Residential Burglary
Burglaries involve breaking and entering a residential or commercial premise for the purpose of committing a crime. As shown in Figure 12, the average monthly residential burglary rate in the 18 cities with available data exhibited a downward cyclical trend over time. Across the cities, the residential burglary rate was 26% lower in 2023 compared to 2019. The rate fell by 3% from 2022 to 2023, a decrease of 1,052 incidents. Compared to the same period in 2022, residential burglary decreased by 4% in the first half of 2023 and by 1% in the second half of the year.
Figure 12. Residential Burglary Rates in 18 Cities, 2018–2023
Nonresidential Burglary
In the 18 cities with available data, the monthly nonresidential burglary rate exhibited a flat cyclical pattern before the pandemic, as shown in Figure 13. Shortly after the beginning of the pandemic, there was an abrupt and brief spike in May 2020, coinciding with protests over the killing of Floyd and the broader issue of police violence. Across the sample, the nonresidential burglary rate was 3% higher in 2023 compared to 2019. The rate decreased by 7% from 2022 to 2023, a decrease of 3,110 incidents. When compared to the same period in 2022, nonresidential burglary decreased by 4% in the first half of 2023 and by 9% in the second half of 2023.
Figure 13. Nonresidential Burglary Rates in 18 Cities, 2018–2023
Larceny
Larcenies are thefts unaccompanied by force or breaking and entering. Shoplifting and thefts of property from motor vehicles are the two most common forms of larceny. Data from 32 cities show that the average monthly larceny rate exhibited a distinct cyclical pattern over time, as shown in Figure 14. The larceny rate was 7% lower in 2023 compared to 2019. The rate fell by 4% from 2022 to 2023, representing 19,209 fewer incidents in the sample cities. Compared to the same period in 2022, larceny decreased by 2% in the first half of 2023 and by 5% in the second half of the year.
Figure 14. Larceny Rates in 32 Cities, 2018–2023
Motor Vehicle Theft
The average monthly motor vehicle theft rate rose and fell cyclically from January 2018 to March 2020 in the 34 cities with available data, as shown in Figure 15. There was a modest increase in the summer of 2020, followed by large spikes in the summer of 2022 and 2023. Across the sample, the motor vehicle theft rate surged by 105% from 2019 to 2023. The rate increased by 29% from 2022 to 2023, representing an additional 56,843 incidents in the study cities. Compared to the same period in 2022, motor vehicle thefts increased by 39% in the first half of 2023 and by 21% in the second half of 2023.
Figure 15. Motor Vehicle Theft Rates in 34 Cities, 2018–2023
Figure 16. Percentage Change in Motor Vehicle Theft in 34 Cities, 2022–2023
The increase in motor vehicle theft over recent years reverses a decades-long decline. Motor vehicle theft peaked in 1991 at a rate of 659 per 100,000 people. By 2019, that rate had dropped 67% to 220 per 100,000 people–nearly identical to the rate in 1963. In 2022, the most recent year for which full national data are available, the motor vehicle theft rate climbed to 282.7, the highest rate since 2008 (315.4 per 100,000). In addition to the direct impacts on victims, motor vehicle theft is a concern because stolen vehicles are often used to commit crimes, such as robberies, burglaries, and drive-by shootings. Please see the Council’s fact sheet on motor vehicle theft for a more detailed look.
Shoplifting
Shoplifting is a theft by someone other than an employee of the victim of an item displayed for sale. Data from 25 cities show that reported shoplifting abruptly declined during the onset of the pandemic, and it continued to drop through June 2020. As shown in Figure 17, the shoplifting rate was 2% lower in 2023 compared to 2019. The rate jumped upward by 22% from 2022 to 2023, representing 14,743 additional incidents in the study cities. Compared to the same period in 2022, reported shoplifting increased by 18% in the first half of 2023 and by 26% in the second half of the year. Because these data rely on incidents reported to police, and because reporting practices vary across the retail industry, they almost certainly undercount total shoplifting by significant quantities.
Figure 17. Shoplifting Rates in 25 Cities, 2018–2023
Shoplifting and retail theft have received widespread attention from the retail industry, policymakers, and the media in the last two years. A CCJ analysis found that the median value of stolen goods increased from 2019 to 2021 and that the overwhelming majority of reported shoplifting incidents involved one or two people, rather than the large groups seen in viral videos of “smash-and-grab” incidents. Similarly, while the number of assaults that occurred in a store increased from the first half of 2019 to the first half of 2023, the share of shoplifting incidents that also involve an assault accounts for about 1% of total incidents. Please see CCJ’s 2023 report on shoplifting for a more detailed discussion of this crime2.
2 New York City could not be included in this report because the city’s incident-level crime complaint data, where shoplifting data are located, was not updated in time. However, the city had about 4,500 fewer reported shoplifting incidents in 2023 compared to 2022.
Drug Offenses
Drug offenses include arrests for the manufacture, sale, or possession of illicit drugs. The average monthly drug offense rate in the 21 cities with available data dropped by several points early in the pandemic and has remained about 25% below pre-2020 levels (see Figure 18). Across the sample, the drug offense rate was 27% lower in 2023 compared to 2019. The rate rose by 4% from 2022 to 2023, an increase of 2,868 incidents. Compared to the same period in 2022, drug offenses rose by 3% in the first half of 2023 and by 5% in the second half of the year.
Figure 18. Drug Offense Rates in 21 Cities, 2018–2023
Summary and Conclusion
This study is the twelfth in a series of reports for CCJ exploring crime patterns since the emergence of the coronavirus pandemic and establishment of the Council’s National Commission on COVID-19 and Criminal Justice. Updating the earlier analyses, this study reveals both increases and decreases in crime rates in a sample of U.S. cities through December 2023.
Overall, the findings suggest that most offenses in the sample cities are bending back toward 2019 levels, though some are not. Homicide, the most serious of the crimes, has yet to fully recede but, except in some cities, is trending in the right direction. Likewise, aggravated assaults and gun assaults declined last year but remain above 2019 levels, with gun assaults 32% higher than before the pandemic.
Though the homicide trends are encouraging, fatal and non-fatal violence continue to warrant significant attention from policymakers. Even if the homicide rate were to fall back to pre-pandemic levels, the 2019 level (5.0 per 100,000 U.S. residents) was 15% higher than the 2014 rate (4.4 per 100,000), which was the lowest since World War II3. While a 5.0 per 100,000 homicide rate is roughly half the modern peak of 9.8 recorded in 1991, this progress is of little comfort to families who lose loved ones to violence.
Moreover, returning to 2019 levels is far from guaranteed. As noted in a prior Council report, the homicide rate was 32.5% higher in the first two months of 2020 compared to 2019, before COVID-19 restrictions and summer protests. The United States must not accept crime levels that kill and wound thousands of people each year—lives that can be protected and saved through effective violence-reduction strategies. CCJ’s Violent Crime Working Group produced a menu of such strategies in its Ten Essential Actions report, which served as the foundation of the Violent Crime Reduction Roadmap published in December 2023 by the Department of Justice’s Office of Justice Programs.
Motor vehicle theft continues to stand out because of its startling upward trajectory, with rates well above pre-2020 levels and continuing to rise in 2023. Much of this increase is likely the result of thefts of certain Kia and Hyundai models, which lack a key security feature making them vulnerable to theft. While motor vehicle theft rates were already on the rise before these vehicles became popular targets, the increases over the last two years dwarf the 2020 increase. As with motor vehicle thefts, carjackings have increased from 2019 levels, though there was a reversal of that trend and slight drop from 2022 to 2023.
The remaining crimes covered in this analysis are either below or approximately at 2019 levels. The most notable declines were seen for residential burglary and drug offenses. Reported incidents of shoplifting, a crime that received enormous attention in state legislatures, Congress, and the media in 2023, dropped abruptly early in the pandemic but increased from 2022 to 2023. The rise in shoplifting and robberies, offenses committed to acquire money or property, could reflect a return to normal living conditions and daily routines, which increased the opportunities to commit certain types of offenses. The sustained decrease in drug offenses requires additional investigation.
In short, crime trends do not occur in isolation from broader social and economic forces but neither are they immune from short-term intervention. There are multiple strategies that do not require new laws or large new public expenditures that can reliably and sustainably reduce crime. Leaders in the public and private sectors should redouble their efforts to implement these approaches.
3LaFree, G. D. (1998). Losing legitimacy: Street crime and the decline of social institutions in America. Westview.
Offense Dashboard
Figure 19. Monthly Crime Trends by Type and City, 2018–2023
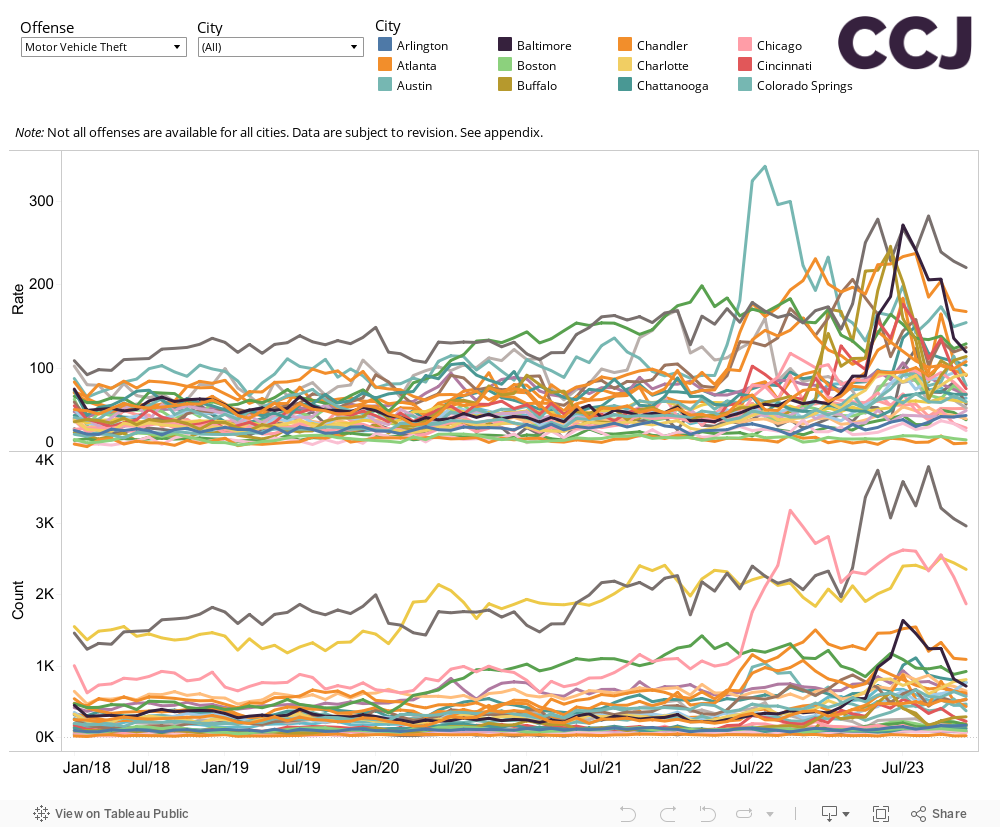
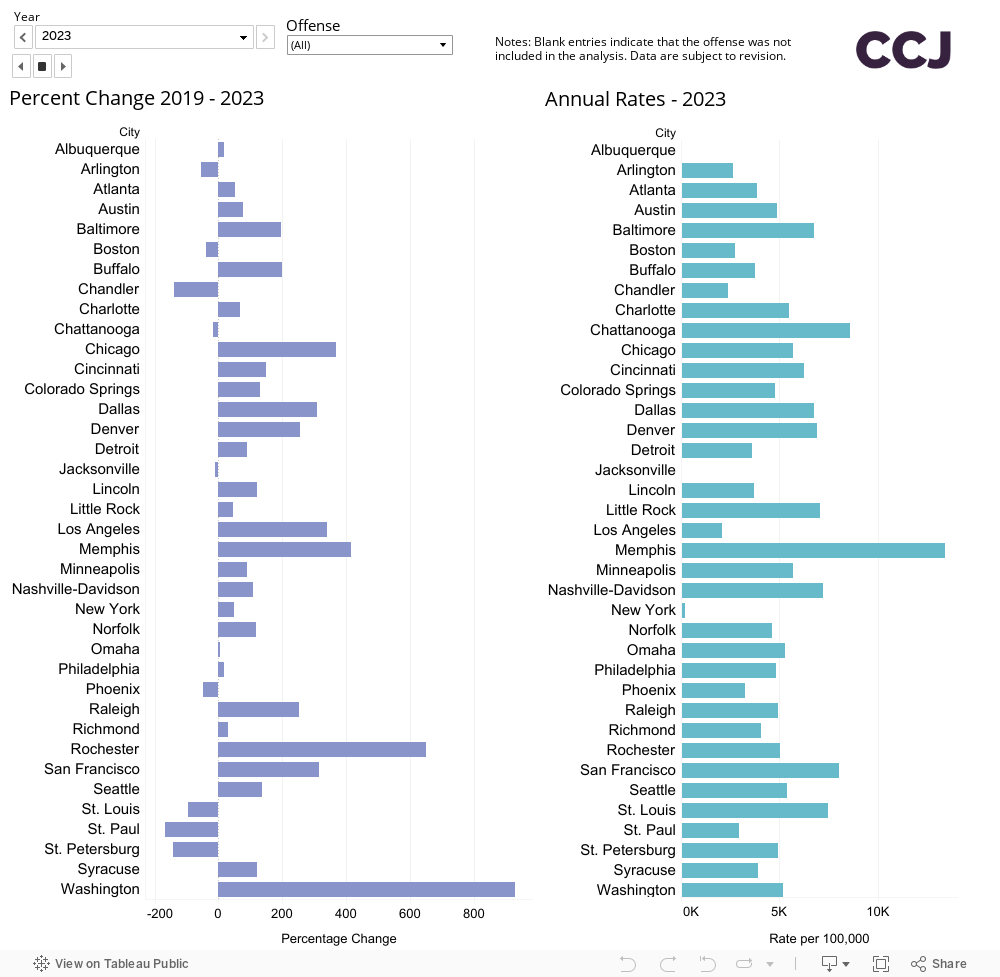
Figure 20. Percent Change in Crime from 2019 and Annual Rates, 2019–2023
Appendix
*Syracuse reported zero homicides in 2020 in their open data source; therefore, data for 2020 are not included here.
KEY
- Homicide
- Aggravated Assault
- Gun Assault
- Domestic Violence
- Robbery
- Carjacking
- Residential Burglary
- Nonresidential Burglary
- Larceny
- Shoplifting
- Motor Vehicle Theft
- Drug Offenses