Trends in Gun Theft
Leveraging Data to Inform Crime Policy
June 2025
By Deborah Azrael, Ph.D., Harvard Injury Control Research Center, and
Susan T. Parker, Ph.D., Northwestern University
Hundreds of thousands of crimes involving firearms occur each year in the United States. In 2022, for example, guns were used in more than three quarters of murders, one third of robberies, and a quarter of aggravated assaults.1 But less is known about how people who use guns in violence acquire their weapons.
One source of guns used in crimes is theft.2 While research on the role of gun theft in gun crime is limited,3 a small but growing body of evidence suggests that stolen guns may play a significant role in violent crime. Stolen guns are more likely than other guns to be recovered in crimes,4 and gun crime appears to increase in neighborhoods from which guns have been recently stolen.5 Despite the potential importance of stolen guns as a source of guns used in crime, data on gun theft trends are limited.
This report explores gun theft incidents reported to law enforcement6 using data from 2,098 law enforcement agencies that consistently reported crime data to the FBI’s National Incident-Based Reporting System (NIBRS) from 2018 to 2022, the most recent five-year period for which data were available when the analysis was conducted. The sample of reporting agencies represent about 12% of the nation’s law enforcement agencies and covers approximately 25% of the U.S. population, including 16 cities with a population greater than 250,000. Results from analyses on reported gun thefts are presented at three levels: the full sample of 2,098 jurisdictions, level of urbanization, and the 16 largest cities in the sample (those with populations over 250,000).
Key Takeaways
- Rates of gun theft reported to law enforcement remained relatively stable from 2018 to 2022 at between 70 and 80 guns stolen per 100,000 people. But rates increased by 42% in large urban areas over the period, while declining by 22% in rural areas.
- Memphis, TN, had the highest rate of gun theft among 16 cities with a population over 250,000 in the sample, at 546 per 100,000 people. This was two to 10 times higher than the rate in other study cities.
- The rate of guns reported stolen from motor vehicles increased by 31% over the period, while the rate of guns reported stolen during residential and commercial burglaries dropped by 40%. Rates of gun thefts from vehicles were highest and rose the most steeply in the most rural areas.
- About half of all guns reported stolen from motor vehicles were stolen from vehicles parked at residences. However, thefts from vehicles in parking lots or garages increased by 76% over the study period.
- Vehicles appear to increasingly be targeted by those seeking to steal guns. In 2018, 5% of all vehicle break-ins resulted in gun thefts; by 2022, this share had increased to 9%.
Glossary of Terms
- Gun Thefts: Incidents in which one or more guns were stolen, as reported to law enforcement and recorded in the FBI’s National Incident-Based Reporting System (NIBRS)
- Level of Urbanization: Jurisdictions were categorized for this report based on the National Center for Health Statistics (NCHS) Urban-Rural Classification scheme, which places U.S. counties into one of six categories ranging from “large metropolitan area” to “rural.” These categories help classify counties based on population size and density, from large urban centers to less-dense rural regions.
- National Incident-Based Reporting System (NIBRS): A comprehensive system for collecting and reporting incident-level data on crimes reported to law enforcement in the U.S. Part of the FBI’s Uniform Crime Reporting Program, NIBRS is the successor to the Summary Reporting System, which provides limited information on a select number of crimes. NIBRS captures information on a wide range of offenses and includes details such as victim demographics, offender characteristics, the relationship between the victim and offender for each incident, if known, as well as details about stolen goods and their value, when applicable.
A note about the data and methodology: Data presented throughout this report were drawn from stolen gun incidents reported to law enforcement and submitted to NIBRS from 2018 to 2022. The sample included 2,098 agencies that a) consistently reported monthly crime data, b) reported at least one stolen gun incident per year, and c) were jurisdictions serving a population greater than zero (i.e., excluding hospital, campus, and university law enforcement agencies). Population estimates per reporting agency come from the FBI’s “Agencies 2000-2022” file, available via the Crime Data Explorer.
County-based 2013 rural-urban continuum codes from the National Center for Health Statistics (NCHS) were used to assign reporting law enforcement agencies a measure of county- level urbanization based on the county or counties in which the jurisdiction was located. See the supplemental methodology report for details.
Reported gun theft remained stable from 2018 to 2022
From 2018 to 2022, the annual number of reported gun thefts in 2,098 law enforcement agencies remained relatively stable at approximately 65,000 per year, varying from a low of 58,784 in 2019 to a high of 67,621 in 2021 (Figure 1a). Because there were only modest changes in population over the period, rates of gun theft followed a similar pattern, with a low of about 72 per 100,000 people in 2019 to roughly 82 per 100,000 in 2020 and 2021 (Figure 1b).
Figure 1a. Total Number of Reported Gun Thefts, 2018-2022
Figure 1b. Total Reported Gun Theft Rates, 2018-2022
The total value of stolen guns exceeded $314 million from 2018 to 2022. Although the number of guns stolen in any given incident is not recorded in NIBRS, the monetary value of all stolen guns per incident is recorded.7 The total monetary value of all guns stolen from 2018 to 2022 was $314,659,418. Based on an average gun value of $500,8 approximately 1.3 guns are estimated to be stolen per incident (Figure 2).
Figure 2. Estimated Number of Stolen Guns, 2018–2022
Guns are most often stolen in the summer. Figure 3 shows marked seasonal variation in gun theft, with thefts peaking in the summer and declining in winter months; this pattern is consistent with trends typically observed for other property crimes. Gun thefts were higher in the summer and fall of 2020 (peaking in August), which marked the height of the COVID-19 pandemic.
Figure 3. Reported Gun Theft by Month, January 2018–December 2022
Rates of reported gun theft increased 42% in large urban areas
Figure 4 depicts reported gun theft by level of urbanization. The greatest number of gun thefts reported in the sample—representing about a third of all incidents—took place in medium-sized metropolitan areas. Large core metropolitan areas and large fringe metropolitan areas (suburbs) each accounted for about a fifth of incidents. Collectively, small metropolitan, nonmetropolitan, and non-core areas accounted for roughly a third of gun theft incidents over the period.
A different pattern emerged when rates, rather than counts, of reported gun theft were considered. In 2018, such rates were highest in the most rural areas and lowest in large fringe metropolitan areas; by 2022, however, rates were highest in large urban areas, having increased by 42% (from 80 per 100,000 people in 2018 to 114 per 100,000 in 2022). In contrast, rural areas saw a decline in gun theft rates, from 99 in 2018 to 76 per 100,000 in 2022. Large fringe metropolitan areas (suburban areas) had the lowest rates of gun theft, averaging a rate of approximately 60 per 100,000 throughout the period.
Figure 4. Total Incidents in Which a Gun Was Stolen by Level of Urbanization, 2018–2022
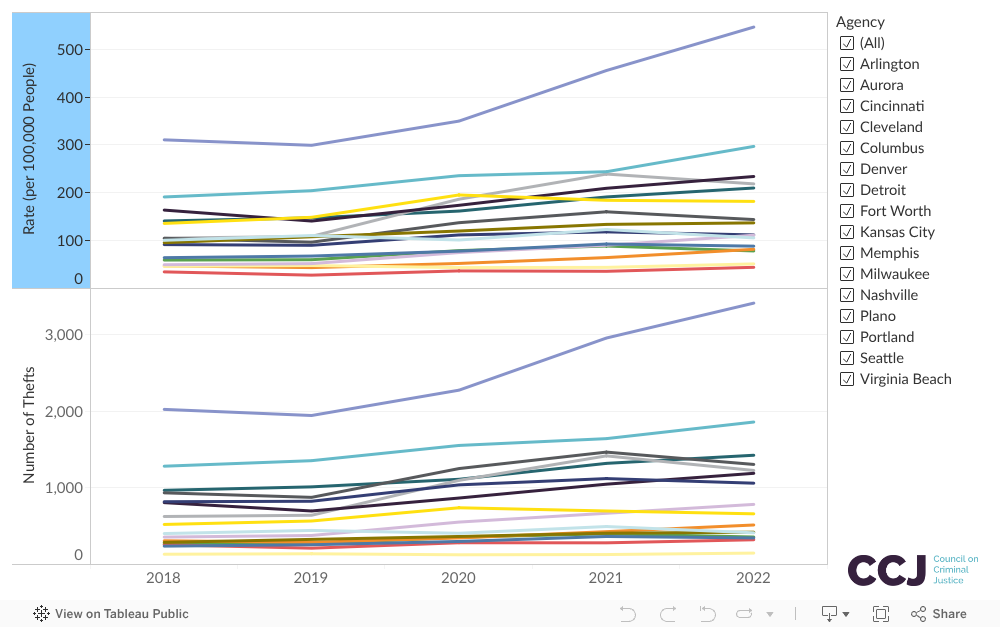
Memphis, TN, had the highest rate of reported gun theft among 16 large urban areas in the sample
To further illuminate patterns of reported gun theft in large urban areas, this analysis examined a subsample of 16 cities with populations over 250,000. As shown in Figure 5, while counts and rates of gun theft increased across the 16 cities, the magnitude of those increases varied.
Memphis, for example, had by far the highest rate of gun theft in the sample, at 546 per 100,000 people in 2022. This rate was nearly twice that of Detroit, MI, the city with the next highest rate of gun thefts in 2022, at 297 per 100,000. The Memphis rate was also more than 10 times the rate of the cities with the lowest rates of gun theft incidents: Plano, TX (51 per 100,000) and Seattle, WA (44 per 100,000).
Peaks in gun theft rates in several cities occurred in 2020 or 2021. For example, in Cleveland, OH, this trend is clearly visible: the rate increased from 136 per 100,000 in 2018 to 195 per 100,000 in 2020, but fell thereafter.
Figure 5. Total Incidents in Which a Gun Was Stolen in 16 Large Cities, 2018–2022
Guns were most often stolen from residences, although thefts from parking lots and roads increased over time
Figure 6 shows changes in the primary locations from which guns were reported stolen in sample jurisdictions. Residences were the most common location. Guns were stolen from residences in about two-thirds of incidents (63%) from 2018 to 2022, but the share of all reported gun thefts that were from residences declined over time. Rates of gun theft from residences declined from 54.6 to 46.2 per 100,000 people over the period.
Rates of gun theft from parking lots/garages and highways/roads/alleys, in contrast, increased substantially. From 2018 to 2022, the rate of gun thefts from parking lots/garages rose from 8.4 per 100,000 to 14.2, and the rate from highways/roads/alleys increased from 5.6 to 8 per 100,000.
Figure 6. Reported Gun Theft by Location, 2018–2022
Rates of gun theft from parking lots and roads doubled in large urban areas
Rates of reported gun theft by location varied substantially across levels of county urbanization. As depicted in Figure 7, gun thefts from residences in the sample’s large metro areas remained stable (46 per 100,000 in 2018 and 48 per 100,000 in 2022), while falling in less urban areas. The overall increase in gun theft in large urban areas over the period was driven by a doubling of gun theft rates from parking lots/garages (from 15 per 100,000 in 2018 to 32 in 2022) and from highways/roads/alleys (an increase from 11 to 20).
Figure 7a. Reported Gun Theft by Location and Level of Urbanization, 2018–2022
Figure 7b. Gun Theft Rate by Location and Level of Urbanization, 2018–2022
Rates of gun theft from parking lots tripled in Memphis
As shown in Figure 8, patterns of reported gun theft by location also varied substantially by city across the sample’s 16 cities with populations over 250,000. Across virtually every theft location category, Memphis had the highest rates of gun theft (excluding gun theft from highways/roads/alleys, where rates were highest in Detroit and Milwaukee). For example, the rate of gun theft from residences in Memphis increased 37% between 2018 and 2022, from 169 per 100,000 in 2018 to 232 in 2022.
Rates of gun theft from parking lots/garages were highest in Memphis and Nashville, TN, and Kansas City, MO, the three cities in the sample that also had the greatest increase in gun theft rates from those locations. Here, too, Memphis was an outlier, with rates of gun theft from parking lots/garages tripling from 61 per 100,000 in 2019 to 180 in 2022.
Figure 8. Reported Gun Theft Location in 16 Large Cities, 2018–2022

Gun thefts from vehicles rose as gun thefts from burglaries declined
From 2018 to 2022, the majority of reported gun thefts were from motor vehicle break-ins, compared to gun thefts occurring during other types of crimes. Roughly 31% of the 72,649 gun thefts reported in 2018 involved guns stolen from a vehicle, and 24% involved guns stolen during a residential or commercial burglary. After a steep increase between 2019 and 2020, in 2022 about 40% of the 77,089 reported gun theft incidents involved thefts from vehicles, and only 14% involved guns stolen during burglaries.
While the decline in the fraction of gun thefts from burglaries began in 2019 and continued, the sharp increase in theft from vehicle break-ins began between 2019 and 2020. This 75% increase represented approximately 8,000 additional gun theft incidents per year in 2021 and 2022.
As shown in Figure 9, count and rate patterns are similar. From 2018 to 2022, the rate of reported gun thefts from vehicles rose by 31%, increasing from 28 per 100,000 in 2018 to 37 in 2022, while the rate of guns stolen during burglaries fell by 40% (21 in 2018 to 13 in 2022). Trends in crime types where guns are stolen were similar to broader trends in overall crimes (see Figure S1 in the supplemental methodology report).
Figure 9. Reported Gun Theft by Crime Type, 2018–2022
Rates of gun theft from vehicle break-ins rose 43% in large urban areas
While the rate of reported gun theft from motor vehicles rose overall, this trend varied by level of urbanization (Figure 10). Two striking patterns emerged: rapid increases in gun thefts from vehicle break-ins in the most urban areas (large, large fringe, and medium metro) and declines across all areas in gun thefts from burglaries. In the largest cities, gun thefts from vehicles were 43% higher in 2022 than in 2018, rising from 37 per 100,000 in 2018 to 65 in 2022. Gun thefts from burglaries fell from a rate of 16 per 100,000 in 2018 to 12 in 2022.
Figure 10a. Reported Gun Theft by Crime Type and Level of Urbanization, 2018–2022
Figure 10b. Reported Gun Theft by Crime Type and Level of Urbanization, 2018–2022
Most, but not all, of the 16 largest cities saw increases in gun theft from vehicle break-ins
Reported gun thefts from vehicles increased across the period in all cities in the sample, with most increases starting in 2020. In Memphis, for example, the rate of gun theft from vehicles increased 125% from 2019 to 2022. However, these increases were not uniform across cities. As Figure 11 shows, there was greater variation in the rate at which guns were being stolen from vehicles in 2022 than was seen in 2018. Several cities, such as Arlington, Columbus, Ft. Worth, Milwaukee, and Virginia Beach, experienced declines in the rate of gun theft incidents from vehicles from 2021 to 2022.
Figure 11. Reported Gun Theft by Crime Type in 16 Large Cities, 2018–2022
Guns were most often reported stolen from vehicles parked at residences, but guns stolen from vehicles in parking lots increased 76%
The number of incidents in which guns were reported stolen during vehicle break-ins increased from roughly 22,000 in 2018 and 2019 to approximately 30,000 in 2021 and 2022 across sample jurisdictions (Figure 12). Most often, guns were reported stolen from vehicles parked at residences (the location of 50% of gun thefts from motor vehicles in 2018 and approximately 40% in 2022). Gun thefts from vehicles that occurred at residences peaked in 2020 and declined sharply thereafter, but gun theft from vehicles in other locations increased steadily throughout the period. From 2018 to 2022, gun thefts from vehicles on highways/roads/alleys increased 59% and thefts from vehicles in parking lots/garages increased 76%.
Figure 12. Reported Gun Thefts from Vehicles by Location, 2018–2022
Guns were twice as likely to be reported stolen from vehicles in parking lots than vehicles at residences in large urban areas
The number of gun theft incidents as well as the rate of gun theft from vehicles differed by location and level of urbanization. Across most jurisdictions, the largest number of gun theft incidents were from vehicles parked at residences (Figure 13). In large urban areas, however, this was generally not the case. In 2018 and 2019, the number of incidents where guns were stolen from vehicles in parking lots/garages in large urban areas was similar to the number of incidents in which guns were reported stolen from vehicles at residences in 2018 and 2019. By 2022, however, guns were nearly twice as likely to be reported stolen from vehicles in parking lots/garages compared to at residences. Across all levels of urbanization, gun thefts from vehicles parked at residences increased in 2020, and declined in 2021 and 2022.
Figure 13a. Reported Gun Thefts from Vehicles by Level of Urbanization, 2018–2022
Figure 13b. Gun Theft Rate from Vehicles by Level of Urbanization, 2018–2022
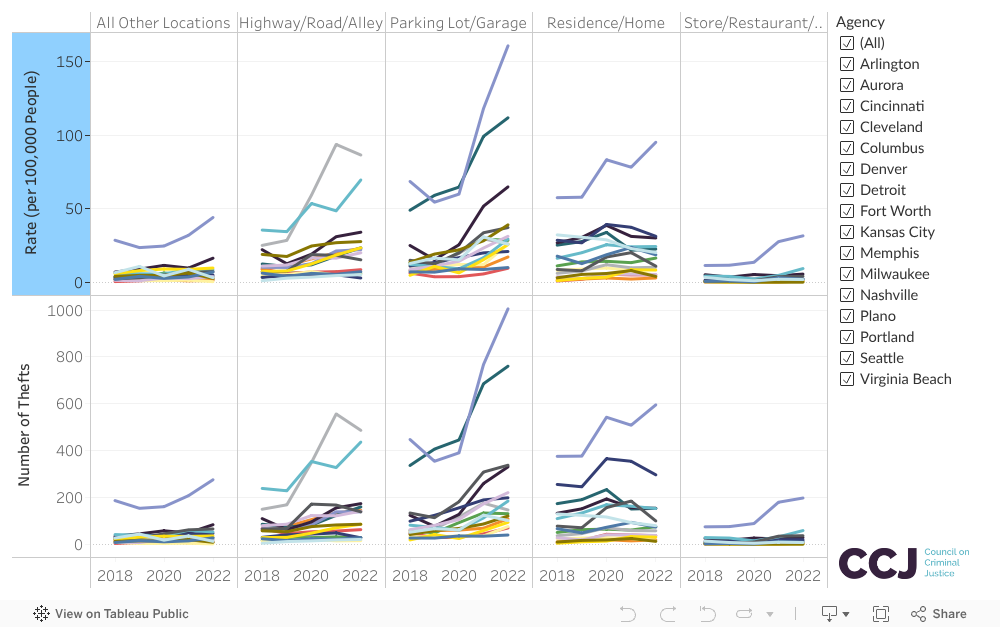
Gun thefts from vehicles in parking lots increased in the 16 largest cities
From 2020 to 2022, the number of incidents in which guns were reported stolen from vehicles in parking lots/garages increased across virtually all of the 16 cities with populations over 250,000, with the greatest increases in Memphis, Nashville, and Kansas City (Figure 14).
The number of guns stolen from vehicles located on highways/roads/alleys also increased across most cities in the sample, with the largest increases in Milwaukee, Detroit, Kansas City, and Nashville.
Figure 14. Reported Gun Theft from Vehicles in 16 Large Cities, 2018–2022
Parked vehicles may be an increasingly likely target for gun theft
Figure 15 shows the proportion of the specific crimes that most frequently resulted in the theft of at least one gun across sample jurisdictions. Approximately 1% of motor vehicle thefts resulted in a stolen gun from 2018 to 2022. By contrast, the proportion of thefts from vehicles in which at least one gun was stolen but the vehicle itself was not rose steadily over the period, from 6% to 9%. This pattern suggests that parked motor vehicles may increasingly be a target for people who steal guns.
Figure 15. Share of Crimes Resulting in a Stolen Gun, 2018–2022
The share of gun thefts from motor vehicles was highest in the most rural areas
Figure 16 shows the proportion of the specific crimes that most frequently resulted in the theft of at least one gun across level of urbanization. While the share of burglaries that resulted in a gun being reported stolen fell from 2018 to 2022, the share of thefts from vehicles that resulted in a stolen gun increased steadily. The share of guns stolen from vehicles was the highest in the most rural areas (24% in the most rural areas in 2022 compared to 10.5% in the most urban areas). This share rose across all levels of urbanization. For example, in the most rural areas, the share rose by six percentage points (from 18% in 2018 to 24% in 2022). In the most urban areas, it rose by 4.5 percentage points from 6% to 10.5%. Small decreases in gun theft from burglaries were similar in rural and urban areas.
Figure 16. Proportion of Crimes Resulting in a Stolen Gun by Level of Urbanization, 2018–2022
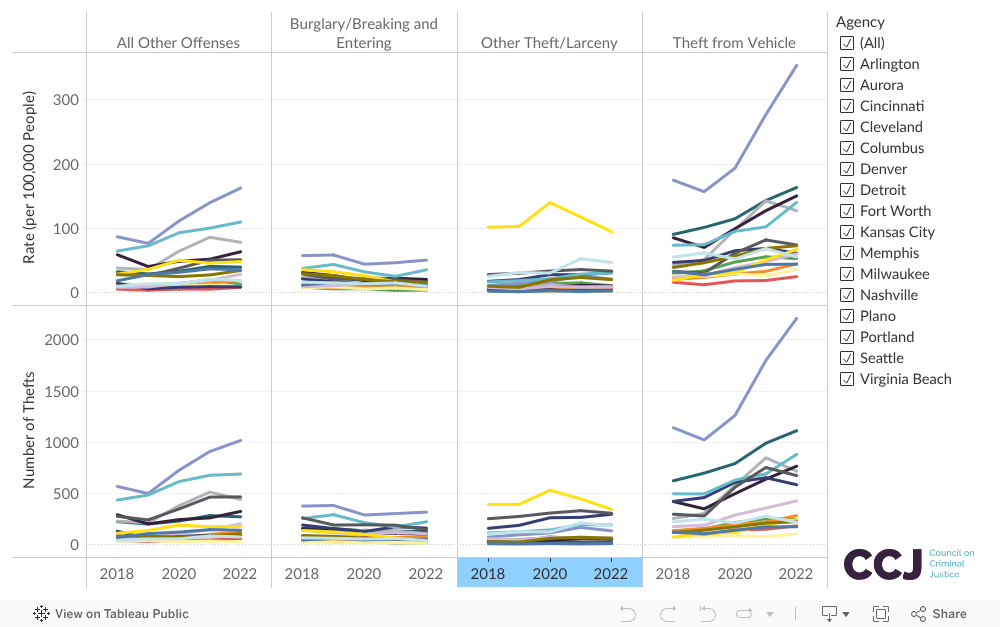
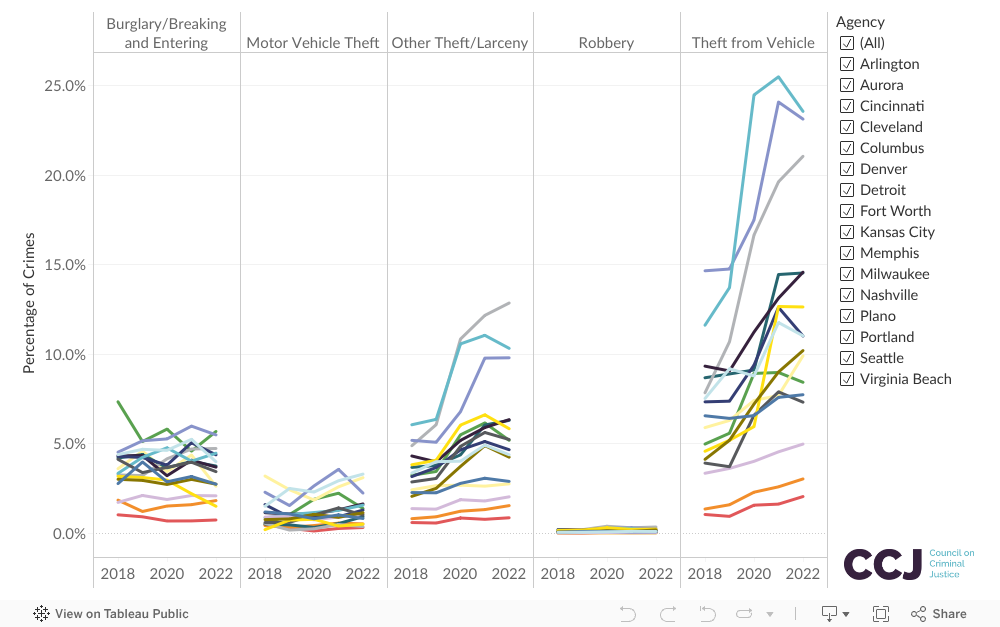
The share of gun thefts from motor vehicles more than doubled in Milwaukee from 2018 to 2022
The share of motor vehicle break-ins that resulted in a gun being reported stolen increased more rapidly than the share of other types of crimes (burglary, motor vehicle theft, and robbery) that resulted in a stolen gun in the sample’s 16 cities with populations over 250,000 (Figure 17). The share of motor vehicle break-ins that resulted in a stolen gun increased over time across nearly all cities in the sample. The largest increases took place in 2020 (in Nashville) and in 2021 (in Detroit, Kansas City, and Portland, OR). In Nashville, the share increased from 9% in 2018 to 15% in 2022. In 2022, more than one in five motor vehicle break-ins in Memphis (23%), Milwaukee (21%), and Detroit (24%) resulted in a stolen gun. Milwaukee had the steepest increase, with the share rising from 8% in 2018 to 21% in 2022.
Figure 17. Reported Gun Theft from Vehicles Compared to Other Property Crimes in 16 Large Cities, 2018–2022
Implications and Future Directions
Two notable trends in gun theft emerged across the localities included in the sample examined for this report. First, there was a sharp increase in the number of gun theft incidents in which guns were reported stolen from vehicles over the period. While guns were predominantly stolen from vehicles parked at residences, a growing share of thefts occurred away from homes, in parking lots. Second, while thefts from vehicles increased, there was a decline in gun thefts from burglaries. This shift could indicate that guns stored in vehicles are now more vulnerable to theft than guns kept inside homes. This finding supports similar observations from several recent studies.9
While the reasons for this shift remain unclear, it presents an opportunity for policy action: promoting laws or regulations that encourage or require gun owners to store their guns in ways that make them less vulnerable to theft. Colorado has taken such a step, enacting legislation requiring guns left in vehicles in a locked container.10 Expanding such policies, and intensifying efforts to prevent vehicle theft, could help curb the number of guns stolen from cars and thus overall, potentially reducing the likelihood they will be used in crimes.
In addition to prevention efforts, improving data collection is critical to better understand and address gun theft. Variation in state reporting requirements and gaps in NIBRS data, such as the lack of information on the number of guns stolen per incident, make it difficult to fully quantify the scale and consequences of gun theft. Expanding mandatory reporting and improving data submissions would help clarify how stolen guns enter illegal markets and are used in crime, giving policymakers and law enforcement better tools to reduce firearm-related violence.
About the Authors
Deborah Azrael, Ph.D., is director of research of the Harvard Injury Control Research Center. Dr. Azrael has more than 25 years of experience leading research on gun violence, injury surveillance, suicide prevention, and gun-related beliefs and behaviors of U.S. adults.
Susan T. Parker, Ph.D., is a research assistant professor of emergency medicine in the Feinberg School of Medicine at Northwestern University. Her research focuses on violence prevention.
Acknowledgments
Stephanie Kennedy, Ernesto Lopez, and other members of the Council on Criminal Justice team provided editing, guidance, and additional support for this report.
This paper was produced as part of the work of the CCJ Crime Trends Working Group with support from the Annie E. Casey Foundation, Arnold Ventures, the Harry Frank Guggenheim Foundation, Southern Company Foundation, Stand Together, and CCJ’s general operating contributors.
Suggested Citation
Azrael, D., & Parker, S. T. (2025). Trends in gun theft: Leveraging data to inform crime policy. Council on Criminal Justice. https://counciloncj.org/trends-in-gun-theft/
Endnotes
1 Federal Bureau of Investigation. (2022). Crime in the U.S. 2022. https://cde.ucr.cjis.gov/LATEST/webapp/#/pages/downloads
2 Bureau of Alcohol, Tobacco, Firearms and Explosives. (2023). National firearms commerce and trafficking assessment (NFCTA): Crime guns – volume two. https://www.atf.gov/firearms/national-firearms-commerce- and-trafficking-assessment-nfcta-crime-guns-volume-two
3 Collins, M. E., Parker, S. T., Scott, T. L., & Wellford, C. F. (2017). A comparative analysis of crime guns. The Russell Sage Foundation Journal of the Social Sciences, 3(5), 96-127. https://doi.org/10.7758/RSF.2017.3.5.05; Cook, P. J. (2018). Gun theft and crime. Journal of Urban Health, 95(3), 305-312. https://link.springer.com/article/10.1007/s11524-018-0253-7; Cook, P. J., Parker, S. T., & Pollack, H. A. (2015). Sources of guns to dangerous people: what we learn by asking them. Preventive Medicine, 79, 28-36. https://doi.org/10.1016/j.ypmed.2015.04.021
4 Laqueur, H. S., McCort, C., Smirniotis, C., Robinson, S., & Wintemute, G. J. (2023). Trends and sources of crime guns in California: 2010–2021. Journal of Urban Health, 100(5), 879-891.https://link.springer.com/article/10.1007/s11524-023-00741-y
5 Billings, S. B. (2023). Smoking gun? Linking gun ownership to crime victimization. Journal of Public Economics, 222, 104874. https://doi.org/10.1016/j.jpubeco.2023.104874
6 Throughout this brief, the term “reported gun theft” is used to refer to reported gun theft incidents. The FBI’s National Incident-Based Reporting System (NIBRS) presents data on the number of incidents during which a gun (or multiple guns) were stolen, therefore all analyses describe the incident, rather than the number of guns stolen in any particular incident.
7 The number of guns stolen in an incident is not a required data field in the NIBRS property segment. NIBRS mandates reporting the type of property stolen (e.g., “firearm”) and its total estimated value. Because the quantity of guns stolen is an optional field, many agencies omit it, making counts unreliable or inconsistent. In contrast, the monetary value of stolen items is a required field, so it is consistently reported and thus available across incidents. See: Federal Bureau of Investigation. (2023). National incident-based reporting system (NIBRS) user manual. Criminal Justice Information Services Division. https://www.fbi.gov/file-repository/ucr/nibrs-user-manual.pdf/view
8 Langton, L. (2012). Firearms stolen during household burglaries and other property crimes, 2005-2010 (NCJ 239436). Bureau of Justice Statistics. https://bjs.ojp.gov/content/pub/pdf/fshbopc0510.pdf. Values were adjusted to 2018 dollars.
9 Freskos, B. (2019, November 20). Missing pieces. The Trace. https://www.thetrace.org/2017/11/stolen- guns-violent-crime-america/; Szkola, J., O’Toole, M. J., Burd-Sharp, S. (2024). Gun thefts from cars: The largest source of stolen guns. Everytown. https://everytownresearch.org/report/gun-thefts-from-cars-the-largest- source-of-stolen-guns-2/
10 Richard, B. (2024, December 27). Colorado law requiring gun owners to lock up guns stored in vehicles to begin Jan. 1, 2025. Denver ABC 7. https://www.denver7.com/news/politics/colorado-law-requiring-gun-owners-to-lock-up-guns-stored-in-vehicles-to-begin-jan-1-2025