Crime Trends in U.S. Cities:Mid-Year 2024 Update
July 2024
Ernesto Lopez
Senior Research Specialist, Council on Criminal Justice
Bobby Boxerman
Graduate Research Assistant, University of Missouri-St. Louis
ACKNOWLEDGMENTS
The authors thank John Roman, director of the Center on Public Safety and Justice at NORC at the University of Chicago, and Alex Piquero, professor of sociology and criminology at the University of Miami, for their guidance, as well as their service to CCJ’s Crime Trends Working Group. CCJ Research Specialist Kathy Sanchez also contributed to this report. In addition, the Council is grateful to Richard Rosenfeld, who passed away in January. An eminent criminologist, Rosenfeld was the original lead author of CCJ’s crime trend reports, an inaugural CCJ member, and a mentor to both authors and many others.
Note: A more up-to-date version of our crime trends report is now available. See the latest crime trends reports here.
Overview
- This study updates and supplements previous U.S. crime trends reports by the Council on Criminal Justice (CCJ) with additional data through June 2024. It examines monthly crime rates for 12 violent, property, and drug offenses in 39 American cities that have consistently reported monthly data over the past six years. The 39 cities are not necessarily representative of all jurisdictions in the United States. Not all cities reported data for each offense (see appendix for which cities reported which offenses); trends in offenses with fewer reporting cities should be viewed with caution. In addition, the data collected for this report are subject to revision by local jurisdictions.
- Eleven of the 12 offenses covered in this report were lower in the first half of 2024 than in the first half of 2023.
- Looking at violent offenses, the number of homicides in the 29 study cities providing data for that crime was 13% lower–319 fewer homicides–during the first half of 2024 than in the first half of 2023. There were 7% fewer reported aggravated assaults and 18% fewer gun assaults in the first half of 2024 than during the same period in 2023. Reported carjacking incidents fell by 26% while robberies and domestic violence incidents declined by 6% and 2%, respectively.
- Motor vehicle theft, a crime that has been on the rise since the summer of 2020, continued its upward trajectory through 2023. That trend reversed in the first half of 2024, however, as there were 18% fewer motor vehicle thefts compared to the first half of 2023.
- Reports of residential burglaries (-14%), nonresidential burglaries (-10%), larcenies (-6%), and drug offenses (-2%) all decreased in the first half of 2024 compared to the first half of 2023. But rates of reported shoplifting, a crime that has received extensive attention from the media and policymakers, increased by 24% over the same period.
- Overall, most violent crimes are at or below levels seen in 2019, the year prior to the onset of the COVID pandemic and racial justice protests of 2020. There were 2% fewer homicides during the first half of 2024 than during the first half of 2019 and 15% fewer robberies. Aggravated assaults and domestic violence incidents also are below levels seen five years ago. Gun assaults were 1% higher during the first half of 2024 than during the first half of 2019, and carjacking, a crime that is relatively uncommon but began to spike shortly after the onset of the pandemic, was 68% higher.
- Property crime trends have been mixed over the last five years. There were fewer residential burglaries and larcenies but more nonresidential burglaries in the first half of 2024 than during the same period five years earlier. Motor vehicle thefts more than doubled during the timeframe, while shoplifting is 10% higher. Drug offenses remain below 2019 levels.
- It is encouraging that rates of violent and property crime are trending in the right direction and are generally below historic peaks seen in the early 1990s, but many cities are still experiencing disturbingly high levels of homicide and motor vehicle theft. To achieve long-term reductions, local, state, and federal governments, along with communities and industries, must adopt evidence-based crime prevention efforts. Additionally, improvements to the nation’s crime data infrastructure are essential to better equip policymakers with timely, accurate, and usable data needed to effectively address community violence and other crime.
Figure 1. Percent Change in Offenses, January to June 2019 to 2024
This report was produced with support from The Annie E. Casey Foundation, Arnold Ventures, the Harry Frank Guggenheim Foundation, Southern Company Foundation, and Stand Together, as well as the John D. and Catherine T. Mac Arthur Foundation and other CCJ general operating contributors.
Introduction
This report updates CCJ’s previous studies of crime changes that began during the early months of the coronavirus pandemic, extending the analyses with data through June 2024. The 39 cities included in this study were selected based on the availability of data at the time of data collection in early July (see the Appendix for full list). They range from Syracuse, NY, the smallest, with about 142,000 residents, to New York City, the largest, with more than 8.4 million residents. The mean population of the cities for which crime data were available is approximately 810,000, while the median population is roughly 480,000.
The report assesses changes between 2018 and June 2024 for 12 crimes: homicide, aggravated assault, gun assault, domestic violence, robbery, carjacking, residential burglary, nonresidential burglary, larceny, shoplifting, motor vehicle theft, and drug offenses. As in previous reports, special attention is given to the trend in homicides.
Crime data for the report were obtained from online portals of city police departments that provided monthly incident-level data for the period between January 2018 and June 2024. Offense counts were converted to monthly crime rates per 100,000 city residents for analysis of monthly and half-year trends. Offense classifications varied somewhat across the cities, and not all cities reported data for each crime. The number of cities reporting crime data ranged from a high of 36 for motor vehicle theft and larceny to a low of seven for carjacking. (See the Appendix for a list of which offenses are included for which cities.)
The crime incident data for this report were obtained within days of the end of the study period to provide a timely snapshot of crime across the nation at the mid-point of the year.1 As a result, these figures may-and often do-differ from data subsequently published by individual police departments. The findings also may differ from other counts released later by the FBI as part of its national crime reporting program. In addition, the figures may differ from those in previous CCJ reports because they are based on a different number and mix of cities. Finally, some offenses are excluded if there is a significant difference between the incident data collected and other published numbers. As such, the data in this report should be viewed as preliminary. In addition, the city sample used for this report is not necessarily representative of all large American cities or the nation as a whole. It is also important to recognize that many offenses are not reported to law enforcement.
Note: Rape and sexual assault are not included in this report because it relies on incident-level data; many jurisdictions exclude these offenses in such data to protect victim identities. The most recent national figures on rape and sexual assault can be found using the Uniform Crime Report or the National Crime Victimization Survey.
1 Efforts to compile crime data continued through July 12, 2024. Cities that had not posted full June 2024 crime data on their websites by that date could not be included in this report.
Changes in Violent Offenses
Homicide
Homicide is the unlawful killing of one person by another. Looking across homicide trends from 2018 to June 2024, the homicide levels in the summer of 2020 far exceeded previous peaks during the study period (Figure A1), amid COVID lockdowns and widespread protests against police violence after George Floyd’s murder in May by Minneapolis police. By the end of 2020, homicide in the United States had climbed 30%, an historic single-year increase. The upward trend continued in 2021, as murders rose another 7% across the entire city sample, but then reversed as homicide dropped 6% from 2021 to 2022. The homicide rate fell further, by 13%, from 2022 to 2023. But it remained 8% higher at the end of 2023 than the rate in 2019.
Figure 2 displays the average homicide rate by half-year in the 29 cities for which homicide incident data were available through June 2024 (see Appendix). The homicide rate during the first half of 2024 was 13% lower, on average, than during the same period in 2023—representing 319 fewer homicides in the cities that reported data. (Figure 3). Across the sample cities, the homicide rate in the first half of 2024 was about 2% lower than the first half of 2019.
Figure 2. Homicide Rates in 29 Cities, January 2018 – June 2024
Figure 3. Monthly Homicide Rates in 29 Cities, 2023 – June 2024
Figure 4 shows the percentage change in homicide, by city, from the first half of 2023 to the first half of 2024, the first half of 2019 to the first half of 2024, and the rate difference from the first half of 2019 to the first half of 2024. Not all cities followed the sample-wide trend. Nine of the 29 cities experienced homicide increases from 2023 to 2024, with Buffalo and Omaha experiencing the largest increases—26% and 25%, respectively. Of the cities that saw homicide fall over this period, Chandler, AZ had a 71% decrease and Virginia Beach experienced a 53% drop, the two largest decreases in the sample. For the most up-to-date information on a specific city, please visit its website.
Figure 4. Change in Homicide in 28 Cities, January to June 2023 vs. 2024
The average homicide rate for the entire sample was 2% lower in the first half of 2024 than in the same period in 2019. The overall decline was driven by large drops in cities with traditionally high homicide rates, including Baltimore, Philadelphia, and St. Louis. Two-thirds of the sample cities (19 out of 29) actually had homicide rates that were higher in the first half of 2024 than in 2019.
To illustrate with two cities, consider that St. Louis and Denver had similar percent changes in the opposite direction: St. Louis’s homicide rate was 23% lower in the first half of 2024 than in the first half of 2019 while Denver’s was 28% higher. But since St. Louis’s homicide rate is about seven times higher than Denver’s, the similar percent changes in the rates yield a significant drop in the combined rate. For additional information and context, see CCJ’s previous crime trends report, which contains a separate analysis of homicides by city homicide level.
Multiple developments could explain the rise and subsequent fall of homicide rates over the past five years, but a lack of conclusive research makes it a challenge to identify decisive factors with certainty. Crime scholars have offered a range of theories, including pandemic-related changes in people’s daily activities and emotional and economic stress levels, changes in police practices and a rupture of public trust in law enforcement, and the suspension or reduction of social supports and programs. For more details, please see the discussion included in a homicide brief from CCJ’s Crime Trends Working Group.
Aggravated Assault
Aggravated assaults are assaults committed with a deadly weapon or those that result in or threaten serious bodily injury to the victim. Like the homicide rate, the aggravated assault rate peaked during the summer of 2020 at levels that surpassed previous highs (Figure A1) and continued to rise through 2021. The aggravated assault rate then fell by 4% from 2022 to 2023 across the sample, but by the end of 2023 it remained 5% higher than in 2019.
Figure 5 displays the average aggravated assault rate by half-year in the 20 cities for which aggravated assault incident data were available through June 2024 (see Appendix). The aggravated assault rate during the first half of 2024 was 7% lower, on average, than during the same period in 2023. January (-14%) and June (-8%) saw the largest decreases during the first half of 2024 compared to the same months in 2023 (Figure 6). The aggravated assault rate in the first half of 2024 was about 0.2% lower than during the first half of 2019.
For a more detailed look at trends in aggravated assault and other assaults, please see CCJ’s fact sheet.
Figure 5. Aggravated Assault Rates in 20 Cities, January 2018 – June 2024
Figure 6. Monthly Aggravated Assault Rates in 20 Cities, 2023 – June 2024
Gun Assault
Gun assaults are aggravated assaults committed with a firearm. Similar to the trends seen for homicide and aggravated assault, the gun assault rate peaked during the summer of 2020 (Figure A1) and declined in 2022. The gun assault rate fell by 12% from 2022 to 2023 across the cities, but by the end of 2023 it was 15% higher than in 2019.
Figure 7 displays the average gun assault rate by half-year in the eight cities for which gun assault incident data were available through June 2024 (see Appendix). The gun assault rate during the first half of 2024 was 18% lower, on average, than during the same period in 2023. April (-19%) and May (-23%) saw the largest decreases during the first half of 2024 compared to the same months in 2023 (Figure 8). The gun assault rate in the first half of 2024 was 1% higher than during the first half of 2019. Given the small number of cities on which these findings are based, they should be viewed with caution. In addition, data on mass shootings are not reported consistently by police agencies and, consequently, are not included in this report. Other organizations collect and publish such data.
For a more detailed look at assault trends, please see CCJ’s fact sheet on the offense.
Figure 7. Gun Assault Rates in 8 Cities, January 2018 – June 2024
Figure 8. Monthly Gun Assault Rates in 8 Cities, 2023 – June 2024
Domestic Violence
Domestic violence primarily consists of aggravated and so-called simple assaults committed against domestic partners or family members. Unlike homicide, aggravated assaults, and gun assaults, incidents of reported domestic violence did not spike in the summer of 2020 (Figure A1) and generally declined through 2022. The domestic violence rate increased by 3% from 2022 to 2023 across the cities, but by the end of 2023 it was 4% lower than in 2019.
Figure 9 displays the average domestic violence rate by half-year in the ten cities for which domestic violence data were available through June 2024 (see Appendix). The domestic violence rate during the first half of 2024 was 2% lower, on average, than during the same period in 2023. Unlike the rate for gun assaults and aggravated assaults, the domestic violence rate was not consistently lower than 2023 levels throughout the first half of 2024, with January and April seeing increases (Figure 10). Overall, the domestic violence rate in the first half of 2024 was 8% lower than during the first half of 2019. Because these findings are based on a small number of cities, they should be viewed with caution.
Please see CCJ’s systematic review of domestic violence for more information on domestic violence during the initial period of the pandemic and related lockdowns.
Figure 9. Domestic Violence Rates in 10 Cities, January 2018 – June 2024
Figure 10. Monthly Domestic Violence Rates in 10 Cities, 2023 – June 2024
Robbery
Robberies are thefts committed with force or the threat of force. Compared to prior years, robbery was lower in the spring to fall of 2020, and by the end of the year was 8% lower than in 2019 (Figure A1). The robbery rate decreased by 2% from 2022 to 2023 across the sample, and at the end of 2023 it was 12% lower than in 2019.
Figure 11 displays the robbery rate by half-year in the 34 cities for which robbery incident data were available through June 2024 (see Appendix). The robbery rate during the first half of 2024 was 6% lower, on average, than during the same period in 2023. April (-11%) and May (-12%) saw the largest decreases compared to the same months in 2023 (Figure 12). The robbery rate in the first half of 2024 was 15% lower than during the first half of 2019.
For a more detailed look at robbery trends, please see CCJ’s fact sheet on the offense.
Figure 11. Robbery Rates in 34 Cities, January 2018 – June 2024
Figure 12. Robbery Rates in 34 Cities, 2023 – June 2024
Carjacking
Carjacking is theft or attempted theft of a motor vehicle by force or threat. The carjacking rate across sample cities increased in the summer of 2020 and mostly continued to climb, with some seasonal variation, through 2023 (Figure A1). The carjacking rate increased by 7% from 2022 to 2023 across the sample cities and was 101% higher by the end of 2023 than in 2019.
Figure 13 displays the carjacking rate by half-year in the seven cities for which carjacking incident data were available through June 2024 (see Appendix). The carjacking rate during the first half of 2024 was 26% lower, on average, than during the same period in 2023. April (-41%), May (-33%), and June (-42%) saw the largest decreases compared to the same months in 2023 (Figure 14 ). The carjacking rate in the first half of 2024 was 68% higher than the first half of 2019. Given the small number of cities on which these findings are based, they should be viewed with caution.
Figure 13. Carjacking Rates in 7 Cities, January 2018 – June 2024
Figure 14. Monthly Carjacking Rates in 7 Cities, 2023 – June 2024
Changes in Property and Drug Offenses
Residential Burglary
Burglaries involve breaking and entering a residential or commercial premise for the purpose of committing a crime. Since 2018, residential burglaries have been declining, with a particularly notable 14% drop from 2019 to 2020. Residential burglary fell by 6% from 2022 to 2023 across the cities, and it was 30% lower by the end of 2023 than in 2019. See Figure A1 for monthly trends.
Figure 15 displays the residential burglary rate by half-year in the 16 cities for which residential burglary incident data were available through June 2024 (see Appendix). The residential burglary rate during the first half of 2024 was 14% lower, on average, than during the same period in 2023. May (-22%) and June (-24%) saw the largest decreases in the first half of 2024 compared to the same months in 2023 (Figure 16). The residential burglary rate in the first half of 2024 was 39% lower in than the first half of 2019.
For a more detailed look at burglary trends, please see CCJ’s fact sheet on the offense.
Figure 15. Residential Burglary Rates in 16 Cities, January 2018 – June 2024
Figure 16. Monthly Residential Burglary Rates in 16 Cities, 2023 – June 2024
Nonresidential Burglary
Shortly after the beginning of the pandemic in 2020, there was an abrupt and brief spike in nonresidential burglary, coinciding with protests over police violence (Figure A1). This May spike contributed to a 43% increase in nonresidential burglary from 2019 to 2020. Although the nonresidential burglary rate fell 5% from 2022 to 2023 across the sample cities, it was 16% higher at the end of 2023 than in 2019.
Figure 17 displays the nonresidential burglary rate by half-year in the 16 cities for which nonresidential burglary incident data were available through June 2024 (see Appendix). The nonresidential burglary rate during the first half of 2024 was 10% lower, on average, than during the same period in 2023. May (-12%) and June (-22%) saw the largest decreases compared to the same months in 2023 (Figure 18). The nonresidential burglary rate in the first half of 2024 was 14% higher than in the first half of 2019.
For a more detailed look at burglary trends, please see CCJ’s fact sheet on the offense.
Figure 17. Nonresidential Burglary Rates in 16 Cities, January 2018 – June 2024
Figure 18. Nonresidential Burglary Rates in 16 Cities, 2023 – June 2024
Larceny
Larcenies are thefts unaccompanied by force or breaking and entering. Thefts from motor vehicles and shoplifting are the two most common forms of larceny. After a 12% decline from 2019 to 2020, with most of the decline occurring after March 2020 (Figure A1), larcenies increased slightly the following two years. The larceny rate fell 4% from 2022 to 2023 across the sample, and by the end of 2023 it was 7% lower than in 2019.
Figure 19 displays the larceny rate by half-year in the 36 cities for which larceny incident data were available through June 2024 (see Appendix). The larceny rate during the first half of 2024 was 6% lower, on average, than during the same period in 2023. January (-8%), April (-8%) and June (-9%) saw the largest decreases compared to the same months in 2023 (Figure 20). The larceny rate in the first half of 2024 was 9% lower than in the first half of 2019.
For a more detailed look at larceny trends, please see CCJ’s fact sheet on the offense.
Figure 19. Larceny Rates in 36 Cities, January 2018 – June 2024
Figure 20. Monthly Larceny Rates in 36 Cities, 2023 – June 2024
Shoplifting
Shoplifting is a theft by someone other than an employee of the victim of an item displayed for sale. After a notable decline in the first few months of the COVID-19 pandemic (Figure A1), shoplifting dropped 15% from 2019 to 2020 and declined another 10% in 2021. Shoplifting increased 12% across the sample cities from 2022 to 2023, but by the end of 2023, the shoplifting rate was 10% lower than in 2019.
Figure 21 displays the shoplifting rate by half-year in the 23 cities for which larceny incident data were available through June 2024 (see Appendix). The shoplifting rate during the first half of 2024 was 24% higher, on average, than during the same period in 2023. February and March (+30%) and May (+37%) saw the largest shoplifting increases relative to the same months in 2023 (Figure 22). The shoplifting rate in the first half of 2024 was 10% higher than in the first half of 2019.
For a more detailed look at shoplifting trends, please see CCJ’s analysis of shoplifting trends and fact sheet on larceny.
Figure 21. Shoplifting Rates in 23 Cities, January 2018 – June 2024
Figure 22. Monthly Shoplifting Rates in 23 Cities, 2023 – June 2024
Motor Vehicle Theft
The average monthly motor vehicle theft rate rose and fell cyclically from January 2018 to March 2020 in the cities with available data (Figure A1). There was a modest increase in the summer of 2020, followed by large spikes in the summers of 2022 and 2023. By the end of 2023, the motor vehicle theft rate increased 28% from 2022 to 2023 across the sample cities, and by the end of 2023 it was 98% higher than in 2019.
Figure 23 displays the motor vehicle theft rate by half-year in the 36 cities for which motor vehicle theft incident data were available through June 2024 (see Appendix). The motor vehicle theft rate during the first half of 2024 was 18% lower, on average, than during the same period in 2023. May (-28%) and June (-30%) saw the largest decreases compared to the same months in 2023 (Figure 24). The motor vehicle theft rate in the first half of 2024 was 66% higher than the first half of 2019.
Figure 23. Vehicle Theft Rates in 36 Cities, January 2018 – June 2024
Figure 24. Monthly Vehicle Theft Rates in 36 Cities, 2023 – June 2024
As described above, motor vehicle theft appears to be trending downward after a sharp upswing that began in mid-2020. Figure 29 shows the percentage change in motor vehicle theft, by city, from the first half of 2023 to the first half of 2024, and from the first half of 2019 to the first half of 2024. During the first half of 2024, 25 of the 36 cities in the sample experienced a decrease compared to the same period in 2023. Looking back further, while many cities have seen recent declines, only five in the sample had lower motor vehicle theft rates in the first half of 2024 compared to the first half of 2019. In 14 of the sample cities, motor vehicle theft was twice as high (an increase of more than 100%) in the first half of 2024 compared to the first half of 2019. In addition to its direct impact on victims, motor vehicle theft is a concern because stolen vehicles are often used to commit other crimes, including robberies, burglaries, and drive-by shootings.
For a more detailed look at motor vehicle trends, please see CCJ’s fact sheet on the offense.
Figure 25. Percentage Change in Motor Vehicle Theft in 36 cities, January to June 2023 – 2024 and January to June 2019 – 2024
Drug Offenses
Drug offenses include arrests for the manufacture, sale, or possession of illicit drugs. During 2020, drug offenses decreased by 28% from 2019 and remained largely unchanged in 2021 and 2022. From 2022 to 2023, the drug offense rate increased 6% across the sample cities; at the end of 2023 it was 22% lower than in 2019. See Figure A1 for monthly trends.
Figure 26 displays the drug offense rate by half-year in the 22 cities for which drug data were available through June 2024 (see Appendix). The drug offense rate during the first half of 2024 was 2% lower, on average, than during the same period in 2023. Compared to the same months in 2023, the drug offense rate was 9% higher in April and 11% lower in June (Figure 27). The drug offense rate in the first half of 2024 was 28% lower than in the first half of 2019.
Figure 26. Drug Offense Rates in 22 Cities, January 2018 – June 2024
Figure 27. Monthly Drug Offense Rates in 22 Cities, 2023 – June 2024
Summary and Conclusion
This study is the thirteenth in a series of reports for CCJ exploring crime changes since the emergence of the coronavirus pandemic and establishment of the Council’s National Commission on COVID-19 and Criminal Justice. Updating the earlier analyses, this study reveals both increases and decreases in crime rates in a sample of U.S. cities through June 2024.
Overall, the findings show an encouraging trend, with levels of 11 of the 12 crimes covered in the report lower in the first half of 2024 than in 2023. Looking over a longer period, the analysis suggests that most offenses in the sample cities are returning to 2019 levels, though some are not. Homicide, the most serious of the crimes, decreased across the sample through the first half of the year, but many cities continue to lose lives at rates that exceed 2019 levels. Aggravated and gun assaults appear to have receded to pre-pandemic levels. Robbery, another serious violent offense, is down 6% at mid-year compared to the same point in 2023, and is 15% below 2019 levels. But rates of carjacking, while down 26% so far this year, remain 68% higher than rates in 2019.
While the homicide trends are encouraging, fatal and non-fatal violence continue to warrant significant attention from policymakers. Even if the homicide rate were to fall back to pre-pandemic levels, the 2019 level (5.0 per 100,000 U.S. residents) was 15% higher than the 2014 rate (4.4 per 100,000), which was the lowest since World War II. While a 5.0 per 100,000 homicide rate is roughly half the modern peak of 9.8 recorded in 1991, such progress is of little consolation to those who lose loved ones to violence. The United States must not accept crime levels that kill and wound thousands of people each year, especially given advancements in our knowledge about what works to prevent and respond to violence. CCJ’s Violent Crime Working Group produced a menu of such strategies in its Ten Essential Actions report, which served as the foundation of the Violent Crime Reduction Roadmap published in December 2023 by the Department of Justice’s Office of Justice Programs.
As for property crimes, patterns are shifting for two offenses that have drawn considerable attention from the media and policymakers: motor vehicle theft and shoplifting. Motor vehicle theft, a crime that has stood out because of its striking upward trajectory, is now trending downward. Still, rates remain well above pre-2020 levels, and vehicle theft merits special attention because stolen cars are often used in the commission of a robbery, drive-by shooting, or other violent offense. Shoplifting, especially “smash-and-grab” episodes caught on video, has reshaped the look and feel of retail outlets and prompted a wave of initiatives—some with multi-million dollar budgets—in multiple jurisdictions in the past year. Mid-year data from the 23 sample cities included in this report show a significant increase (24%) in incidents over the first half of 2023, but more investigation is needed to untangle what’s driving the trend and discern how much it may be due to a rise in actual shoplifting or a rise in the rates at which retailers are reporting incidents to law enforcement.
This study provides up-to-date U.S. crime trends for fewer than 40 cities—a sample limited to large and medium jurisdictions that have consistently reported monthly data over the past six years. While it provides key analyses to advance understanding of current trends, it is not an adequate substitute for timely, accurate, and complete crime data on a much larger scale. In April 2023, the Council on Criminal Justice convened a panel of expert producers and consumers of crime data, the Crime Trends Working Group, to explore changing crime patterns and propose ways to improve the country’s crime data infrastructure. The Working Group’s deliberations produced consensus on multiple areas for urgent action by federal, state, and local agencies, recommendations that were published in June 2024 and can be found here.
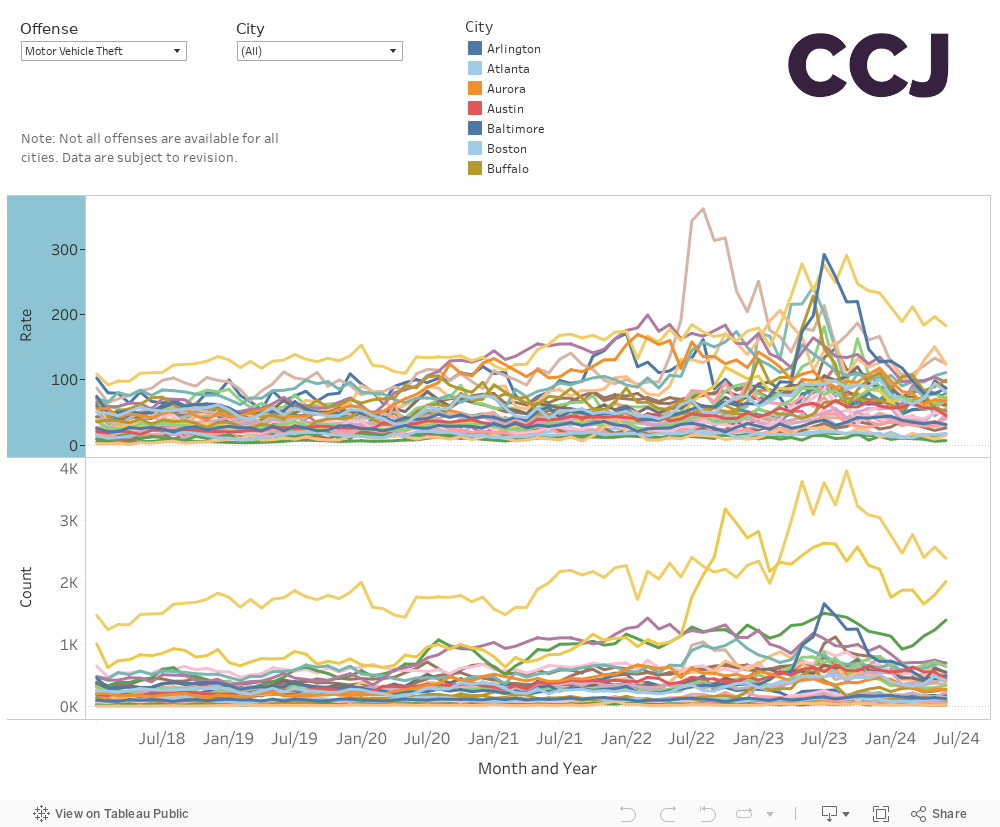
Offense Dashboard
Monthly Crime Trends by Type and City, 2018 – June 2024
Appendix
Figure A1: Monthly Crime Rates, 2018 – June 2024
KEY
- Homicide
- Aggravated Assault
- Gun Assault
- Domestic Violence
- Robbery
- Carjacking
- Residential Burglary
- Nonresidential Burglary
- Larceny
- Shoplifting
- Motor Vehicle Theft
- Drug Offenses