Published on September 12, 2025
President Trump announced on September 12 that he would dispatch military troops and federal agents to Memphis, TN, in an effort to reduce crime and violence. The deployment would make Memphis the third American city to which the Trump administration has sent the National Guard to conduct law enforcement operations, following Los Angeles and Washington, DC. The president has mentioned several other cities, including Chicago and Baltimore, as potential sites for federal intervention.
This brief reviews crime trends in Memphis using data from the Council on Criminal Justice Mid-Year 2025 Crime Trends report, released in July 2025. That report examined offenses recorded by law enforcement in Memphis, Washington, Chicago, Baltimore and 38 other American cities from 2018 through June 2025.
Memphis’s crime trends differ depending on the time period and crime type considered. The homicide rate in Memphis is among the highest in the study sample and is dropping slower than it is in other large cities. But Memphis is outpacing other cities in recent declines in reported carjacking and motor vehicle theft. Declines in reported robbery, residential burglary, and non-residential burglary in Memphis are similar to the average drops in other cities for those offenses.
While Memphis has experienced recent declines for many offenses, homicide and motor vehicle theft remained well above 2019 levels. Homicides for the first half of 2025 were 58% higher than the first half of 2019, and motor vehicle theft levels were double what they were in the first six months of 2025 compared to the same period in 2019. In contrast, reported carjacking and robbery incidents were 45% and 23% lower over this timeframe.
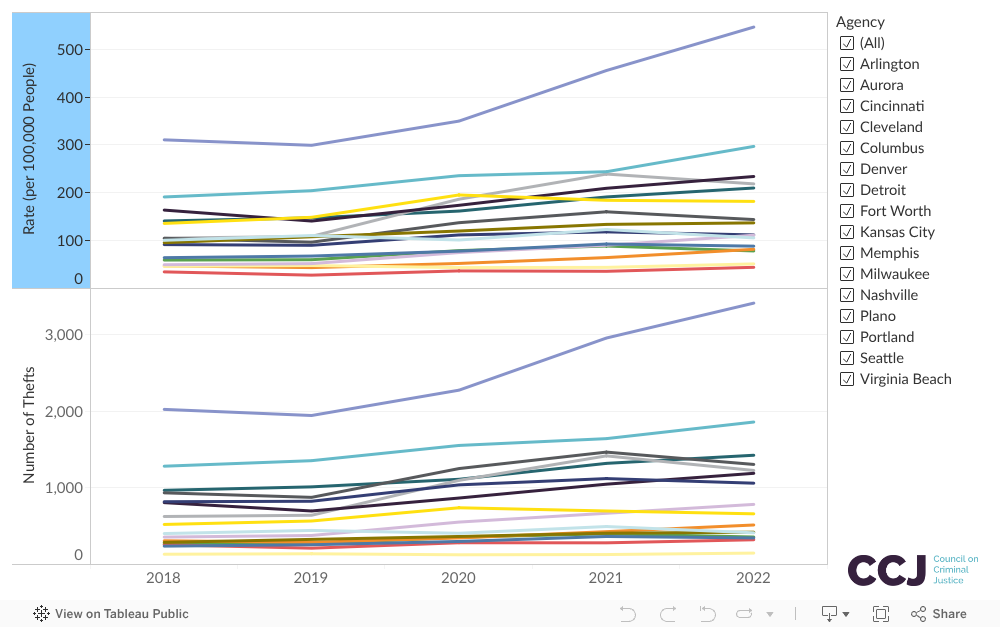
A separate CCJ study of gun theft found that Memphis had by far the highest rate of gun theft in 16 large cities with available data from 2018 to 2022. The Memphis gun-theft rate was nearly twice that of Detroit, MI, the city with the next highest rate of gun thefts in 2022.
The charts below present six-month trends in Memphis for 10 offenses, as well as the separate gun thefts data. Monthly counts and rates for Memphis and other cities in the sample can be explored in the offense dashboard at the bottom of the CCJ Mid-Year 2025 Crime Trends report. Data for three crime types collected in other cities—aggravated assault, gun assault, and sexual assault—were not available for Memphis.
Please note the following limitations: The cities included in this analysis are not necessarily representative of all jurisdictions in the United States. Not all cities published data for each offense (see the Appendix of the Mid-Year 2025 Crime Trends report for which cities reported which offenses), and trends in offenses with fewer reporting cities should be viewed with extra caution. In addition, not all crimes are reported to law enforcement, and the data collected for this report are subject to revision by local jurisdictions.
Homicide
Figure 1 shows Memphis’s homicide rate in six-month intervals (January to June and July to December) from January 2018 through June 2025. In the first half of 2025, Memphis’s homicide rate was 4% lower than in the first half of 2024. The average change in the 30 study cities with data for that crime was -17%.
The homicide rate in Memphis was 58% higher in the first half of this year (January-June 2025) than it was in the first half of the year before the pandemic (January-June 2019). The average change in 30 large study cities was -14%.
Over the past six years, the highest homicide rate in Memphis during the first half of the year was in 2023, when the reported rate was 26 per 100,000 residents. The rate during the first half of 2025 (20.6) was 21% below that peak.
Figure 1. Homicide Rates in Memphis, January 2018 – June 2025
Robbery
Figure 2 shows the reported robbery rate in Memphis in six-month intervals from January 2018 to June 2025. In the first half of 2025, Memphis’s robbery rate was 18% lower than in the first half of 2024. The average change in the 36 study cities with data for robbery was -20%.
Memphis’s robbery rate in the first half of 2025 was 23% lower than in the first half of 2019, while robbery was 30% lower in the study cities.
The highest robbery rate in Memphis during the first half of the year was in 2023, when the reported rate was 231.5 per 100,000 residents. The rate during the first half of 2025 (138.8) was 40% below that peak.
Figure 2. Robbery Rates in Memphis, January 2018 – June 2025
Carjacking
Figure 3 shows the reported carjacking rate in Memphis in six-month intervals from January 2018 to June 2025. In the first half of 2025, Memphis’s carjacking rate was 34% lower than in the first half of 2024. The average change in the nine study cities providing carjacking data was -24%.
Memphis’s carjacking rate in the first half of 2025 was 45% lower than in the first half of 2019, while carjacking was 3% lower in the study cities.
The highest carjacking rate in Memphis during the first half of the year was in 2022, when the reported rate was 32.4 per 100,000 residents. The rate during the first half of 2025 (10.6) was 67% below that peak.
Figure 3. Carjacking Rates in Memphis, January 2018 – June 2025
Domestic Violence
Figure 4 shows the reported rate of domestic violence in Memphis in six-month intervals from January 2018 to June 2025. In the first half of 2025, Memphis’s domestic violence rate was 3% lower than in the first half of 2024. The average change in nine study cities with data on domestic violence was +3%.
Memphis’s domestic violence rate in the first half of 2025 was 7% lower than in the first half of 2019, while domestic violence was 8% lower in the study cities.
The highest domestic violence rate in Memphis during the first half of the year was in 2019, when the reported rate was 1,086.5 per 100,000 residents. The rate during the first half of 2025 (770.2) was 29% below that peak.
Figure 4. Domestic Violence Rates in Memphis, January 2018 – June 2025
Residential Burglary
Figure 5 shows the reported residential burglary rate in Memphis in six-month intervals from January 2018 to June 2025. In the first half of 2025, Memphis’s residential burglary rate was 26% lower than in the first half of 2024. The average change in the 18 study cities with data for the crime was -19%.
Memphis’s residential burglary rate in the first half of 2025 was 49% lower than in the first half of 2019, while residential burglary was 47% lower in the study cities.
The highest residential burglary rate in Memphis during the first half of the year was in 2018, when the reported rate was 479.8 per 100,000 residents. The rate during the first half of 2025 (206.6) was 57% below that peak.
Figure 5. Residential Burglary Rates in Memphis, January 2018 – June 2025
Non-Residential Burglary
Figure 6 shows the reported non-residential burglary rate in Memphis in six-month intervals from January 2018 to June 2025. In the first half of 2025, Memphis’s non-residential burglary rate was 18% lower than in the first half of 2024. The average change in the 18 study cities with data for this crime was -18%.
Memphis’s non-residential burglary rate in the first half of 2025 was 6% lower than in the first half of 2019, while non-residential burglary was identical in the study cities.
The highest non-residential burglary rate in Memphis during the first half of the year was in 2023, when the reported rate was 245.9 per 100,000 residents. The rate during the first half of 2025 (138.5) was 44% below that peak.
Figure 6. Non-Residential Burglary Rates in Memphis, January 2018 – June 2025
Larceny
Figure 7 shows the reported larceny rate in Memphis in six-month intervals from January 2018 to June 2025. In the first half of 2025, Memphis’s larceny rate was 16% lower than in the first half of 2024. The average change in the 36 study cities with data for larceny was -12%.
Memphis’s larceny rate in the first half of 2025 was 12% lower than in the first half of 2019, while larceny was 19% lower in the study cities.
The highest larceny rate in Memphis during the first half of the year was in 2023, when the reported rate was 2,566.9 per 100,000 residents. The rate during the first half of 2025 (1,853.9) was 28% below that peak.
Figure 7. Larceny Rates in Memphis, January 2018 – June 2025
Gun Thefts
Figure 8 shows the rate and number of reported firearm thefts for 16 large U.S. Cities with available data from 2018 to 2022. Memphis had by far the highest rate of gun theft in the sample, at 546 per 100,000 people in 2022. This rate was nearly twice that of Detroit, MI, the city with the next highest rate of gun thefts in 2022, at 297 per 100,000.
The Memphis rate was also more than 10 times the rate of the cities with the lowest rates of gun theft incidents: Plano, TX (51 per 100,000) and Seattle, WA (44 per 100,000).
For more details on these data, please visit the Council’s report on gun thefts.
Figure 8. Total Incidents in Which a Gun Was Stolen in 16 Large Cities, 2018–2022
Shoplifting
Figure 9 shows the reported shoplifting rate in Memphis in six-month intervals from January 2018 to June 2025. In the first half of 2025, Memphis’s shoplifting rate was 1% higher than in the first half of 2024. The average change in the 22 study cities with shoplifting data was -12%.
Memphis’s shoplifting rate in the first half of 2025 was 2% lower than in the first half of 2019, while shoplifting was 4% lower in the study cities.
The highest shoplifting rate in Memphis during the first half of the year was in 2019, when the reported rate was 804.3 per 100,000 residents; the rate during the first half of 2025 was 789.5, 2% lower.
Figure 9. Shoplifting Rates in Memphis, January 2018 – June 2025
Motor Vehicle Theft
Figure 10 shows the reported motor vehicle theft rate in Memphis in six-month intervals from January 2018 to June 2025. In the first half of 2025, Memphis’s motor vehicle theft rate was 36% lower than in the first half of 2024. The average change in the 36 study cities with data for this crime was -25%.
Memphis’s motor vehicle theft rate in the first half of 2025 was 100% higher than in the first half of 2019, while motor vehicle theft was 25% higher in the study cities.
The highest motor vehicle theft rate in Memphis during the first half of the year was in 2023, when the reported rate was 1,318.2 per 100,000 residents. The rate during the first half of 2025 (577.8) was 56% below that peak.
Figure 10. Motor Vehicle Theft Rates in Memphis, January 2018 – June 2025
Drug Offenses
Figure 11 shows the reported drug offense rate in Memphis in six-month increments from January 2018 to June 2025. In the first half of 2025, Memphis’s drug offense rate was 7% higher in the first half of 2025 than in the first half of 2024. There was no difference in the average rates for the 21 study cities during this period.
Memphis’s drug offense rate in the first half of 2025 was 5% lower than in the first half of 2019, while drug offenses were 27% lower in the study cities.
The highest drug offense rate in Memphis during the first half of the year was in 2022, when the reported rate was 439.3 per 100,000 residents. The rate during the first half of 2025 (295.5) was 33% below that peak.
Figure 11. Drug Offense Rates in Memphis, January 2018 – June 2025